With Selzy Omnichannel automation scenarios, you can export detailed scenario reports to analyze campaign performance. The report file is available in XLSX format and includes data for each block and each event inside your scenario.
Use statistics to:
- Analyze overall scenario performance and evaluate each block step by step
- Track how many contacts were sent, delivered, opened, read, and clicked to improve your funnel performance and optimize content
- Identify drop-off points and improve OR, CTR, and CTOR across channels
- Demonstrate clear, structured results to clients or management
- Compare scenario performance across different time periods to spot trends and measure growth
Download statistics
To export a report, go to the Omnichannel automation scenarios page:
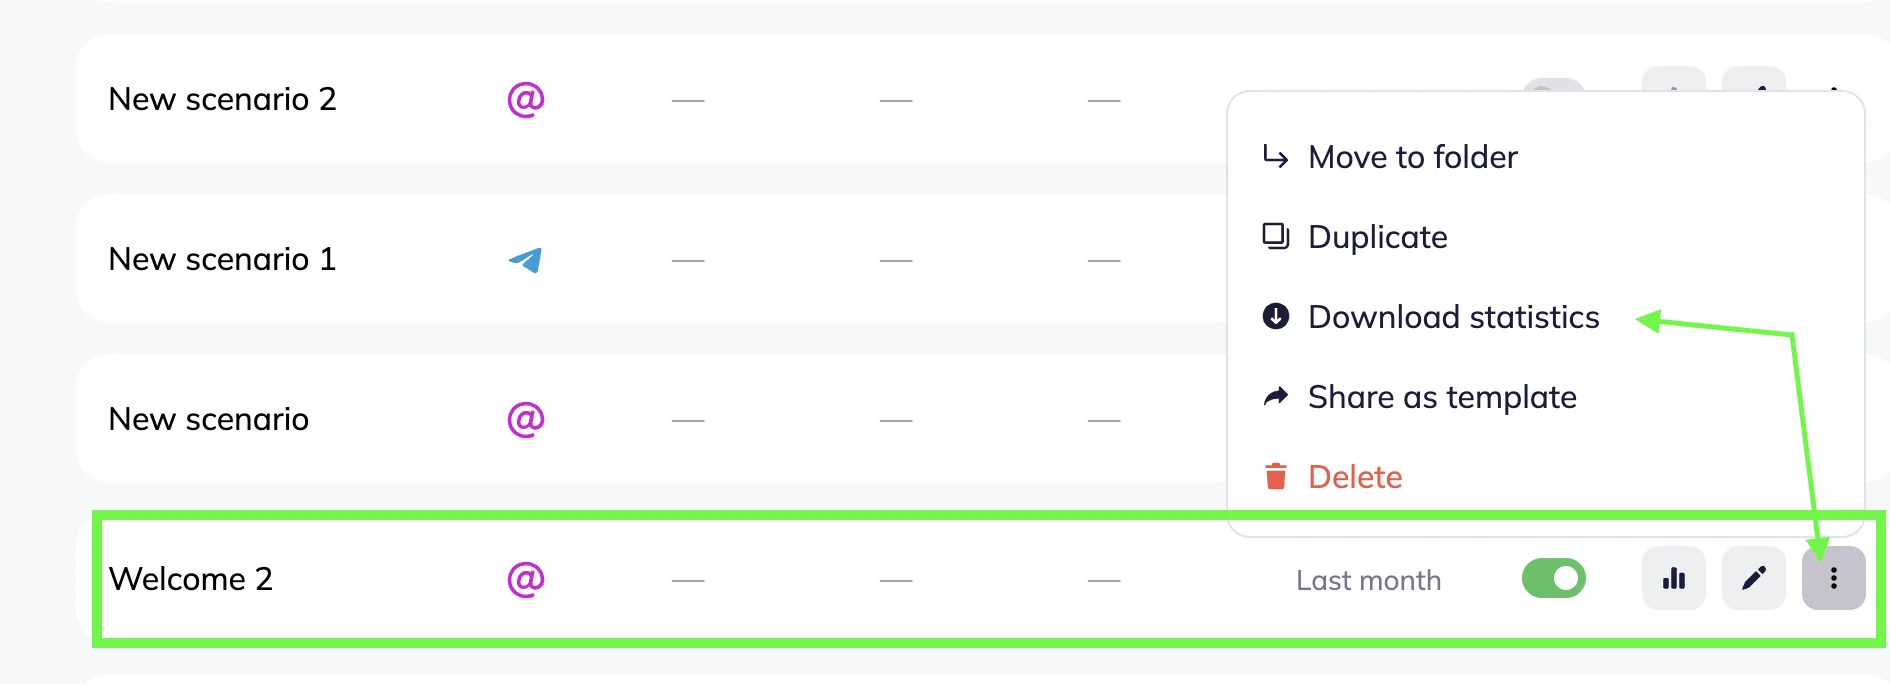
Select the scenario in the Scenario menu (either in Bulk or Triggered tab) → Click on the Scenario actions icon (Three dots) → Select Download statistics.
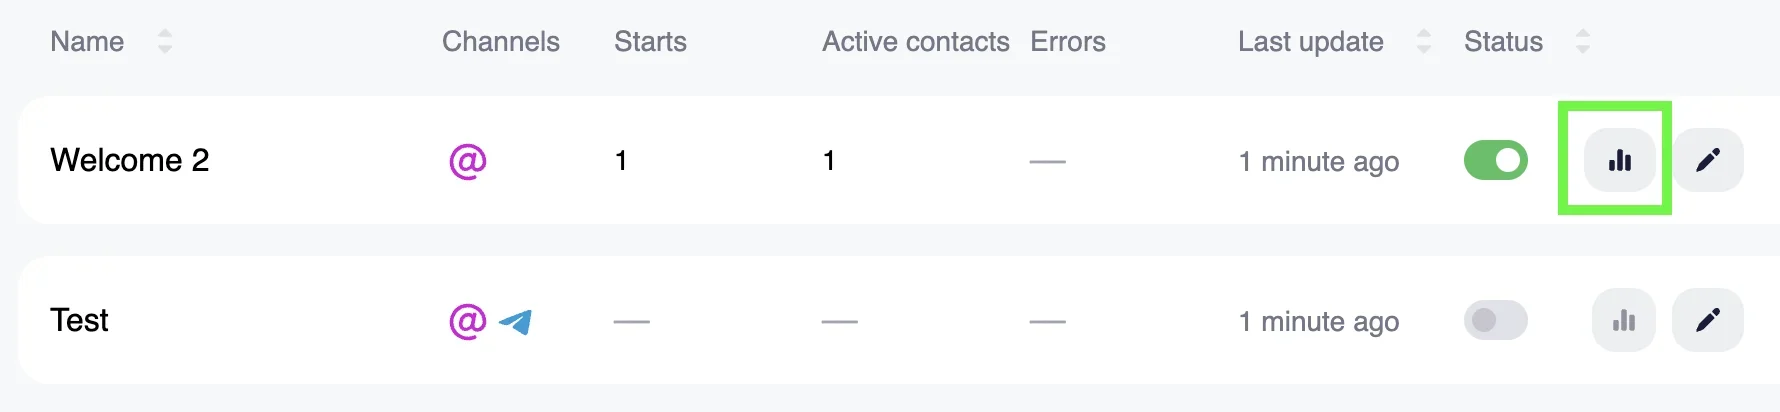
Alternatively, open the scenario in the Statistics mode.
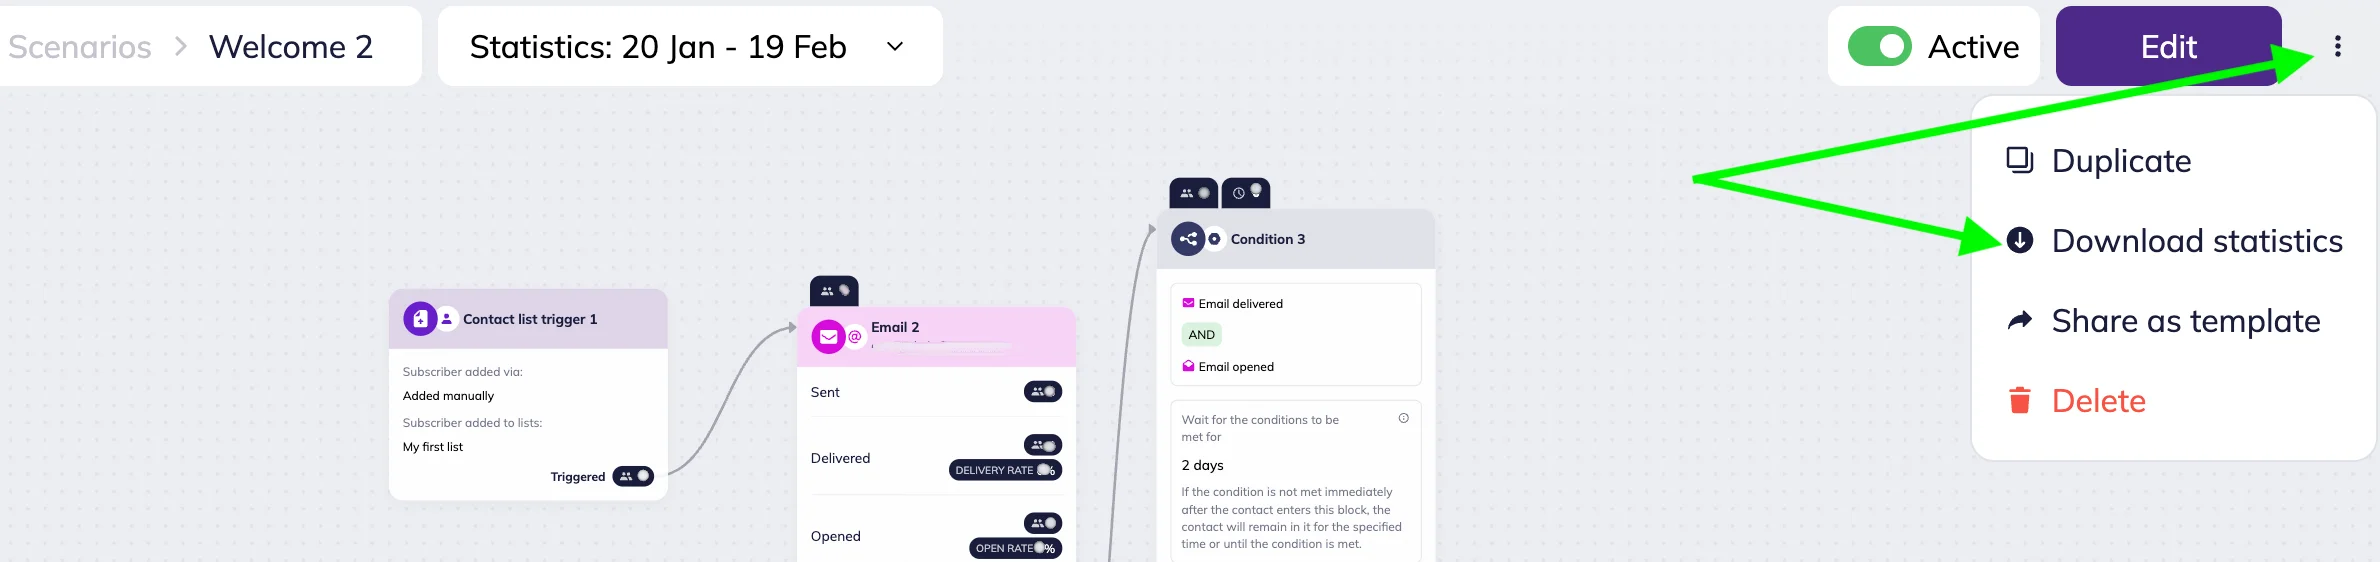
In the scenario workspace, click on the Scenario actions icon (Three dots) on the top-right → Select Download statistics.
The report is downloaded automatically in XLSX format.
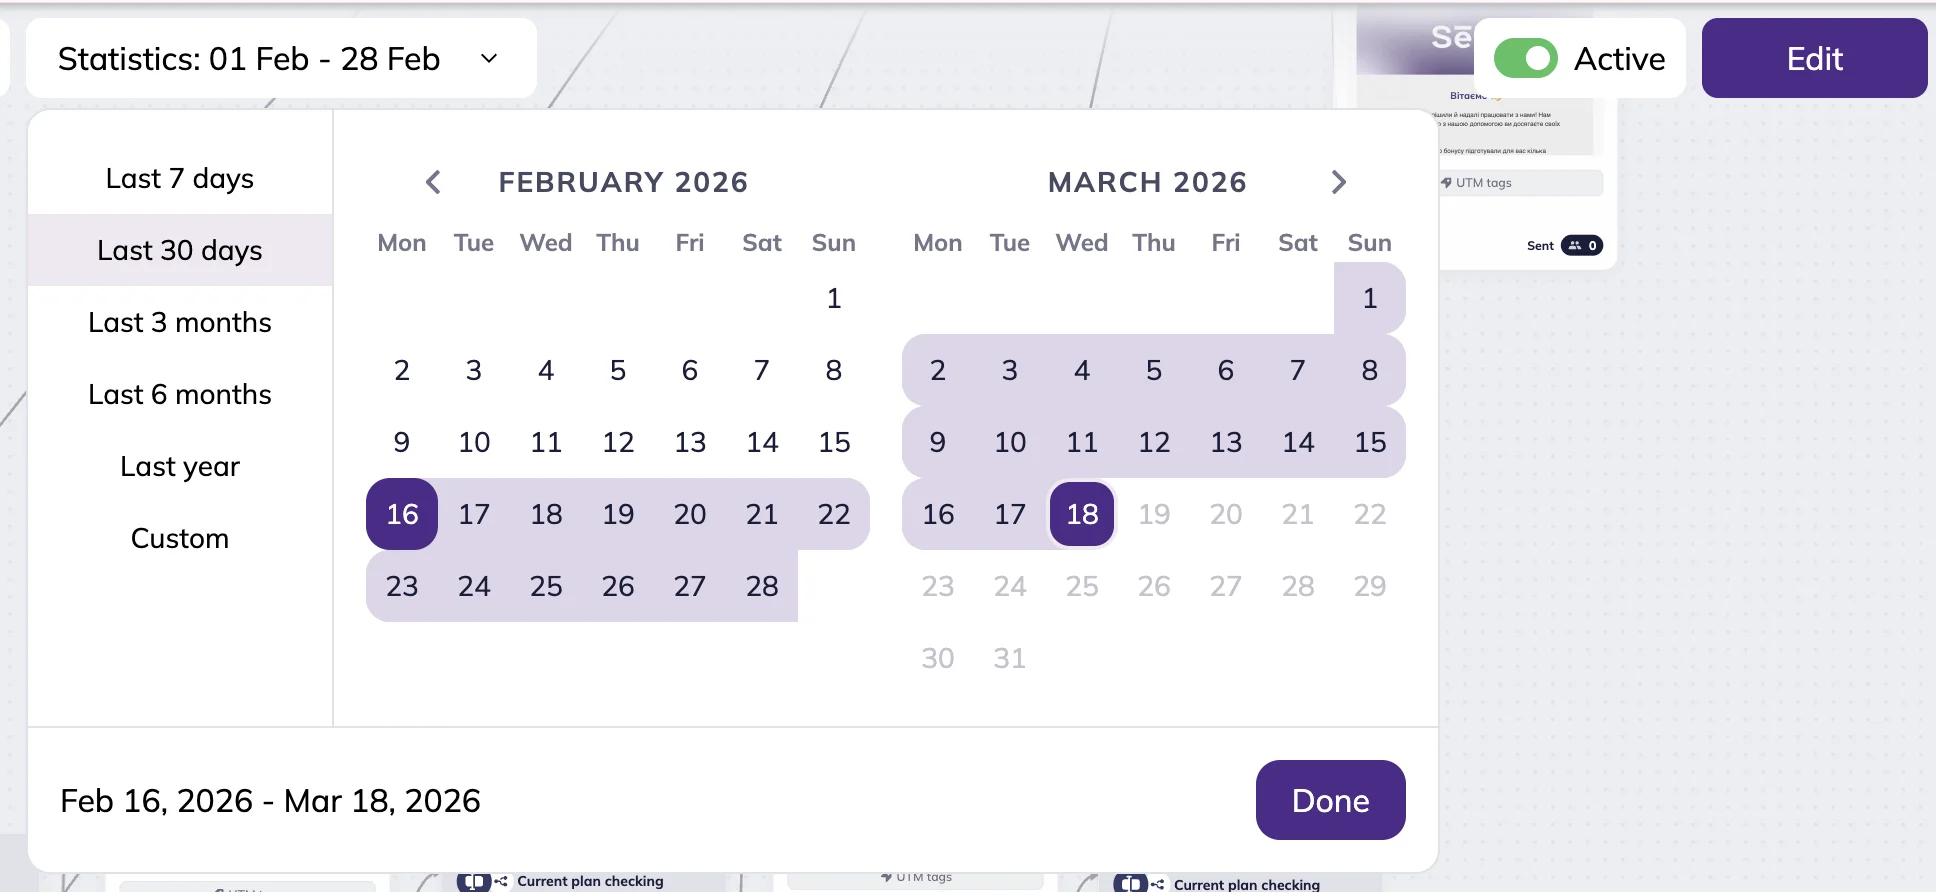
🟡Statistics include data from the moment the scenario was launched up to the date the report is downloaded. You can customize dates in the date picker.
If any blocks that existed during the selected dates were deleted before the report was generated, they will still appear in the report for those dates.
Read the report
The report looks like a table that contains ten columns. Most columns represent specific metrics.
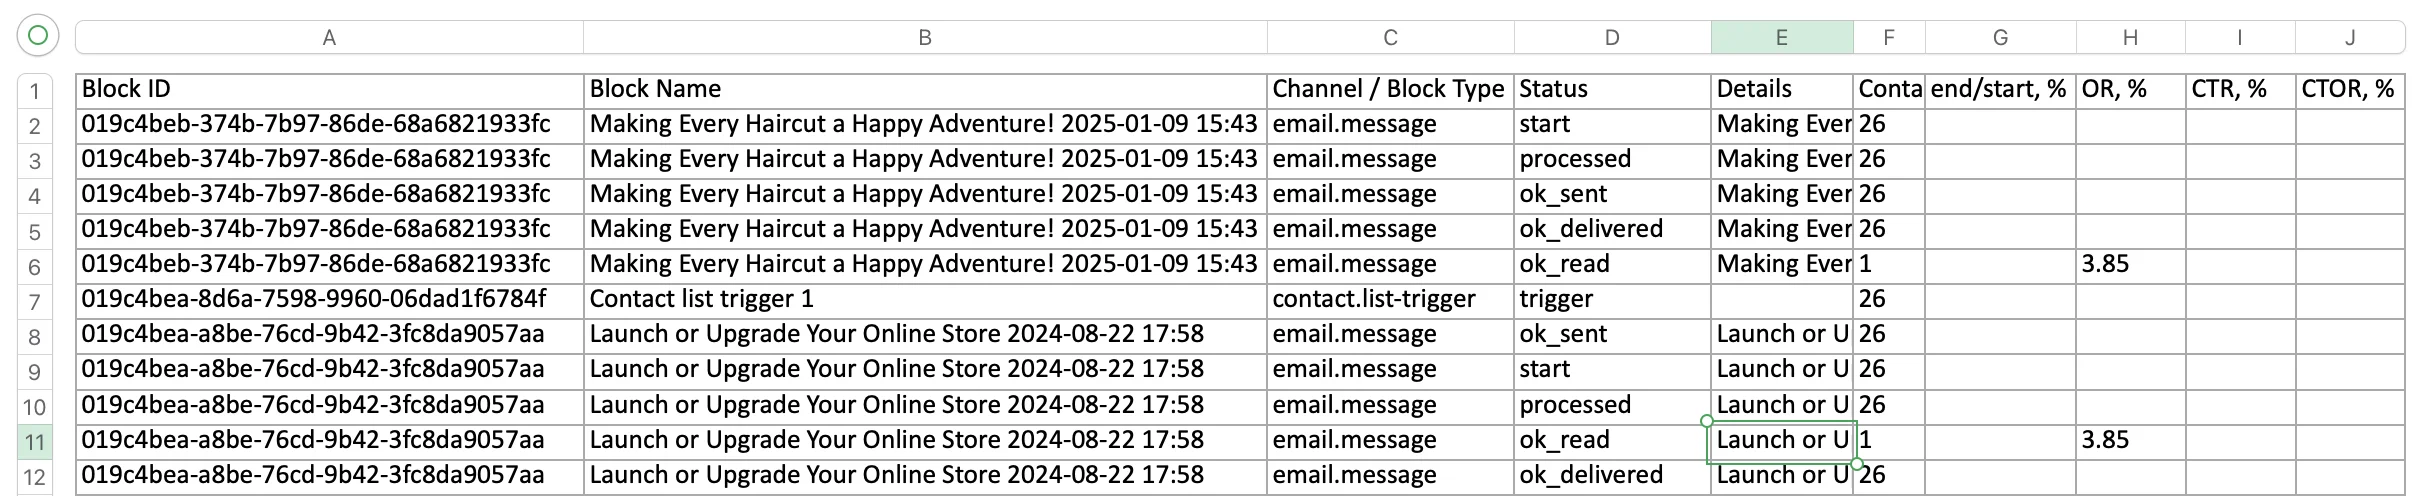
Here is what each column represents:
Block ID, Block name, Channel or Block Type
In the report, one block can be represented by multiple rows. Block ID, name and type make reports easy to navigate.
- Block ID — a unique identifier of the scenario block.
- Block name — the name of the scenario block as shown in the editor.
- Channel / Block Type — channel or block type (Email, Telegram, Condition, trigger, etc.)
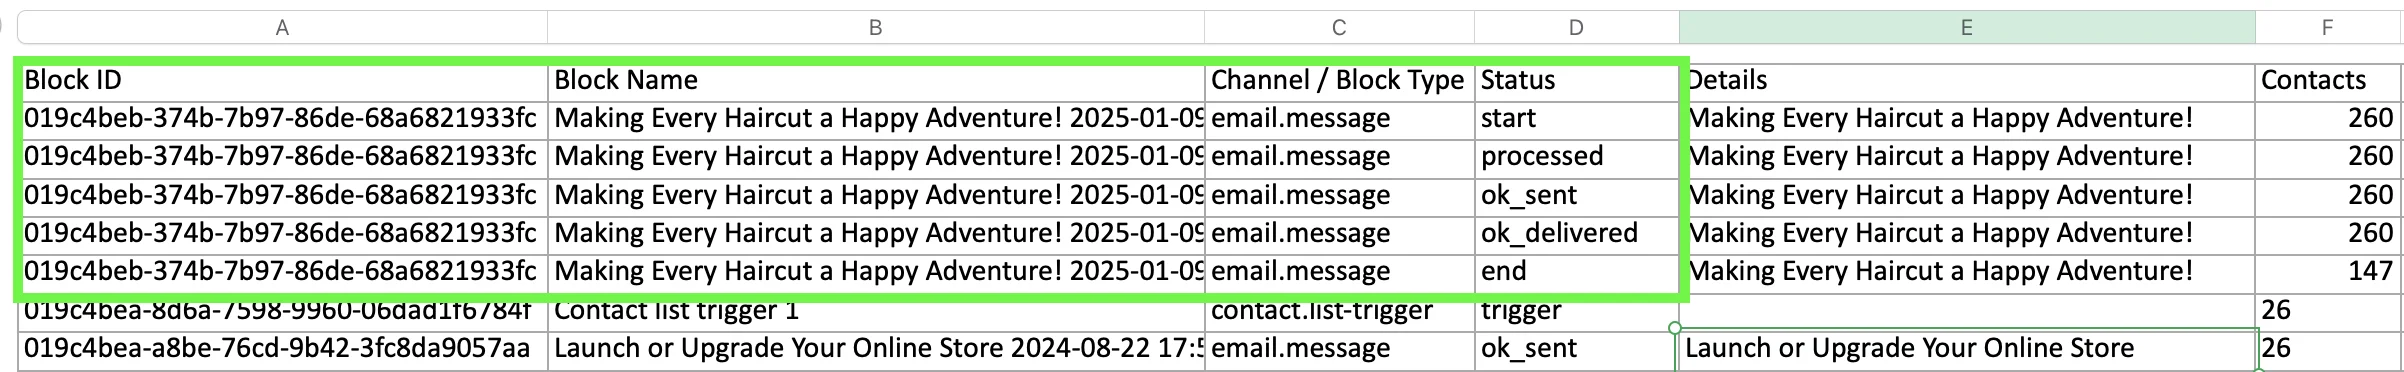
Example
Let’s say, we have an Email block in our scenario with the subject line “Make Every Haircut a Happy Adventure.”
On the screenshot above, you can see that one email block generates five rows. The number of rows depends on the block’s type. Block ID numbers, block names and channel type are identical for each row representing the Email block. Status, on the other hand, is different for each row.
Status
Status represents the event that occurred inside the block.
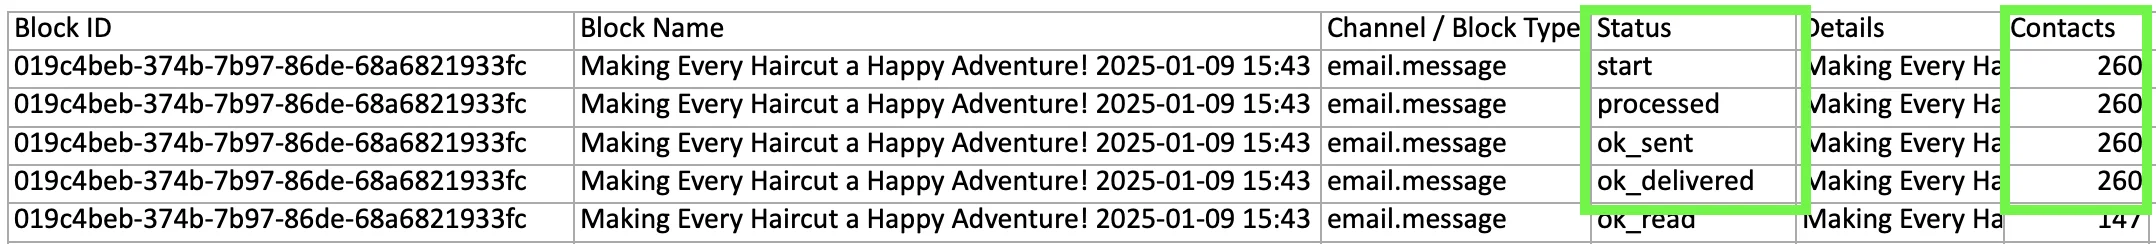
Example
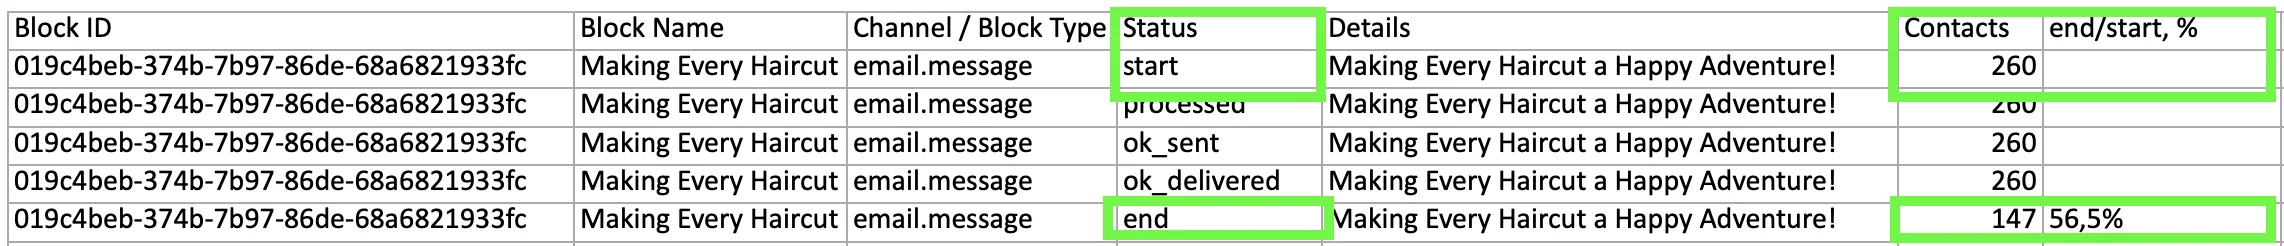
Let’s say, in the “Status” column of the report you see “start” and in the “Contacts” column (Column F) you see the number 260.
This means that 260 contacts entered the specific block.

Status value varies depending on the block type.
Trigger blocks have only one status — triggered (representing the number of contacts that was triggered within the block).
All Communication and Action blocks, as well as Delay block, have start and end statuses — for the number of contacts that entered and exited the block respectively.
A number of blocks — Email, Telegram, and Condition — have additional statuses that we explore below.
Communication statuses
| Status | Description |
| start | Contacts entered the block |
| failed | Contacts didn’t receive the campaign due to delivery error |
| ok_sent | The communication was successfully sent to contacts |
| ok_delivered | The communication was successfully delivered to contacts |
| ok_read | The communication was opened by contacts |
| ok_link_visited | Contacts clicked link or button in the campaign |
| end | Contacts exited the block |
Condition statuses
| Status | Value |
| start | Contacts entered the condition block |
| succeeded | The condition was met |
| failed | The condition was not met |
Contacts
Contacts represent the number of contacts that passed through the block or performed certain actions. The value in this column is used to build funnels and calculate metrics.
Example
Let’s say, in the “Status” column of the report you see “Start” and in the “Contacts” column you see the number 260.
This means that 260 contacts entered the specific block.
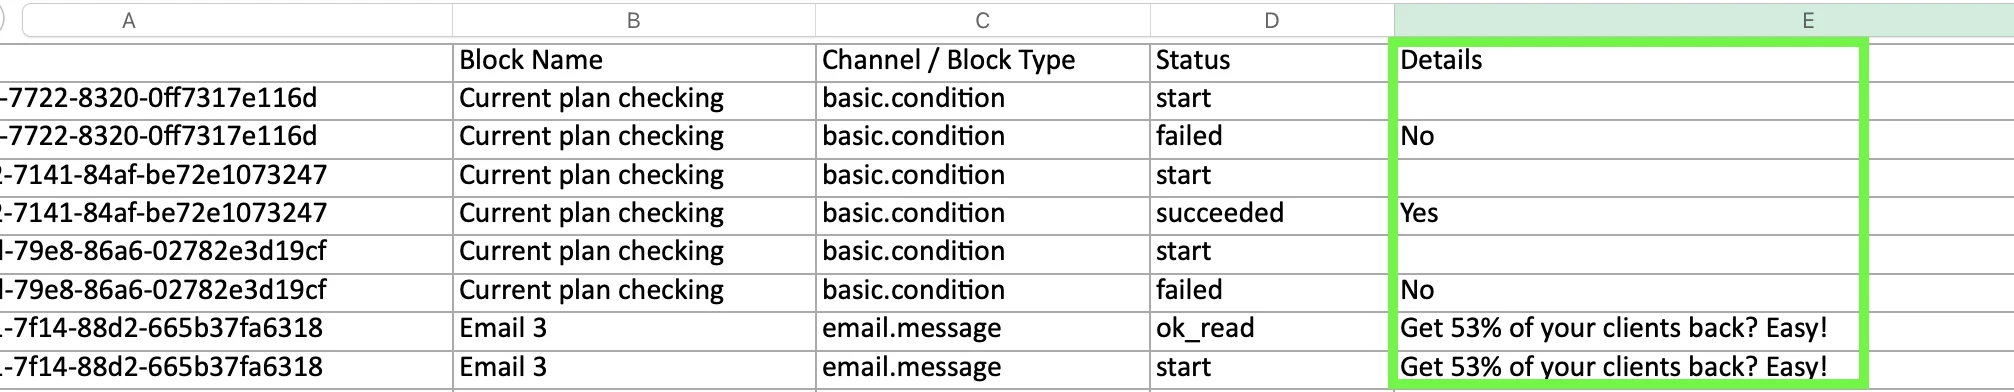
Details
The Details column represents block’s metadata, or technical information about the block. For example:
- Email subject line in the Email block
- Yes or No option in the Condition block
- Tags in the Tag trigger block
In the example below, you can see the details for the Condition and the Email blocks.
End / start
The End/Start column shows the completion rate for each block — how many contacts reached the end of the block compared to how many entered it. This metric helps you analyze drop-off at the block level.
It is calculated by the formula:
end/start = (Contacts with “end” status) / (Contacts with “start” status) × 100
The values used in these formulas can be found in the report rows for the specific block under the corresponding statuses.
Example
If 260 contacts entered the block (start), and 147 contacts reached the end of the block (end), the completion rate would be: end/start = 147 / 260 × 100 = 56.5%.
This means that 56.5% of contacts successfully passed through the block, while the remaining 43.5% dropped off before completing it.
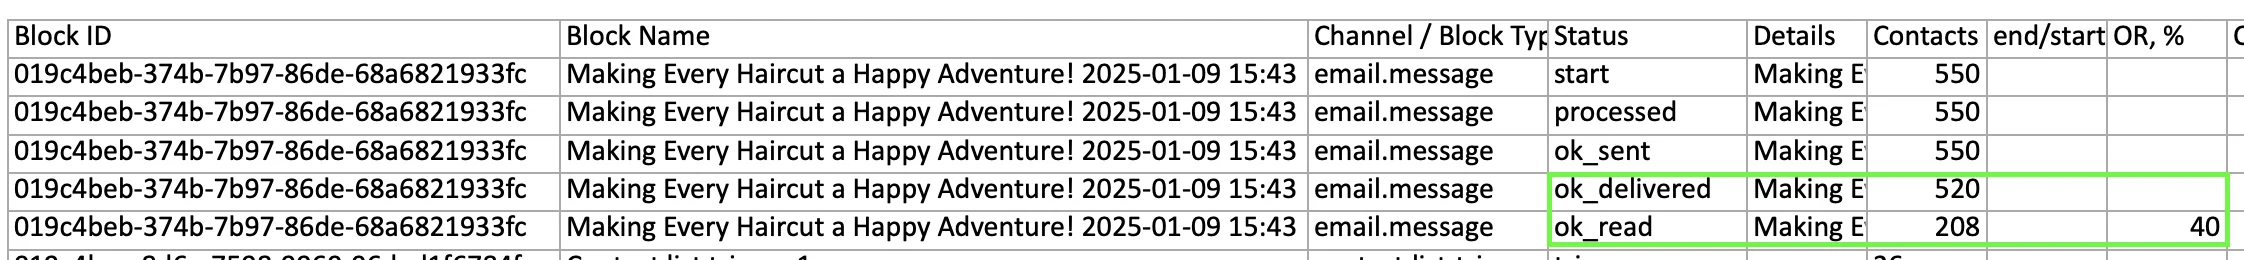
OR (Open Rate)
The OR (Open Rate) column shows the percentage of delivered messages that were opened by contacts. This metric helps you evaluate how effectively your subject line and sender name attract attention.
It is calculated by the formula:
OR = ok_read / ok_delivered × 100
The values used in these formulas can be found in the report rows for the specific message block under the corresponding statuses.
Example
If 520 messages were successfully delivered (ok_delivered in the Status column), and 208 of them were opened (ok_read in the Status column), the Open Rate would be: OR = 208 / 520 × 100 = 40%
This means that 40% of delivered messages were opened by recipients.
Email Open Rate 101: What It Is And What Affects It
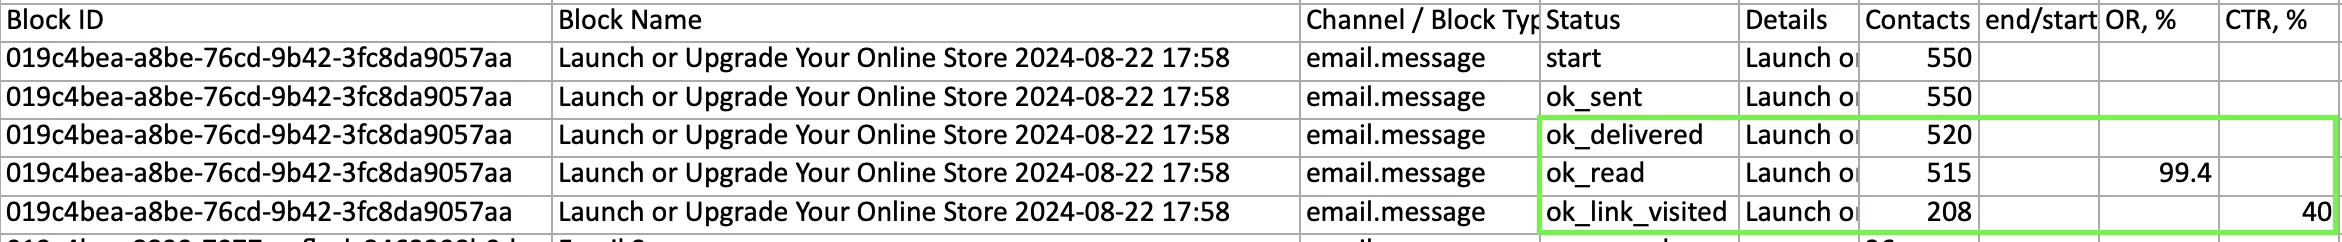
CTR (Click-Through Rate)
The CTR (Click-Through Rate) column shows the percentage of delivered messages that resulted in a click or clicks. CTR helps you evaluate how effective your message content, links, and calls to action are.
It is calculated by two formulas, depending on the channel used:
- Email: CTR = ok_link_visited / ok_delivered × 100
- Telegram: CTR = all clicks / ok_delivered × 100
🟡For Telegram messages, the metric includes clicks on all buttons and links inside the message.
The values used in these formulas can be found in the report rows for the specific message block under the corresponding statuses.
Example
If the email campaign was successfully delivered to 520 contacts (ok_delivered in the Status column), and 208 clicks were recorded (ok_link_visited in the Status column), the Open Rate would be: OR = 208 / 520 × 100 = 40%
This means that 40% of delivered campaigns generated clicks.
CTOR (Click-to-Open Rate)
The CTOR (Click-To-Open Rate) column shows the percentage of opened communications that resulted in a click or clicks. CTOR is primarily used for email campaigns. It helps you evaluate the quality and relevance of your content after the message has been opened.
It is calculated by the formula:
CTOR = ok_link_visited / ok_read × 100
The values used in this formula can be found in the report rows for the specific Email block.
Example
If 515 contacts opened the campaign (ok_read in the Status column), and 208 clicks were recorded (ok_link_visited in the Status column), the CTOR would be: CTOR = 208 / 515 × 100 = 40.39%
This means that 40% of delivered campaigns generated clicks.