


Key takeaways
- An email marketing dashboard helps track marketing activities in one place, spot trends, measure results, and adjust strategies.
- Benefits of using a dashboard include saving time, spotting problems early, identifying what works, easily sharing results, and improving over time.
- Key metrics to track include open rate, click-through rate, click-to-open rate, conversion rate, list growth rate, unsubscribe rate, bounce rate, spam rate, deliverability rate, revenue, and ROI.
If you’re sending emails but not really tracking what happens next, you’re missing out on a huge growth opportunity. That’s what email marketing dashboards are for — they help you see what’s working, what needs fixing, and how your emails are contributing to your bigger marketing goals.
In this article, we’ll tell you what an email marketing dashboard is, what metrics you should know about, and also teach you how to build a perfect dashboard of your own.
Quick answer
An email marketing dashboard is a reporting view that brings your most important campaign, list, deliverability, and revenue metrics into one place. A useful dashboard does more than show numbers: it helps you see what changed, why it matters, and what to do next.
For most teams, the best dashboard includes delivery rate, opens, clicks, click-to-open rate, conversions, unsubscribes, bounces, spam complaints, list growth, and revenue or ROI. Start with the metrics tied to your current goal, then add deeper views for segmentation, automation, and campaign comparison.
What is an email marketing dashboard?
First of all, you might be wondering what a marketing dashboard is. It’s a tool that helps you track all your marketing activities in one place. Instead of checking different platforms separately, you can see all your relevant data, which allows you to spot trends, measure results, and adjust your strategy when needed.
So, an email marketing dashboard does just that, but focuses on your email marketing analytics. It shows all of your important marketing metrics (we’ll get into the specifics later), allowing you to quickly see how your campaigns are performing. You can use an email dashboard to track your overall email marketing results or zoom in on a specific campaign to see how it performed.
Most dashboards pull their data directly from your email service provider, but they can also connect with other tools like CRM systems or website analytics platforms to give you a fuller picture.
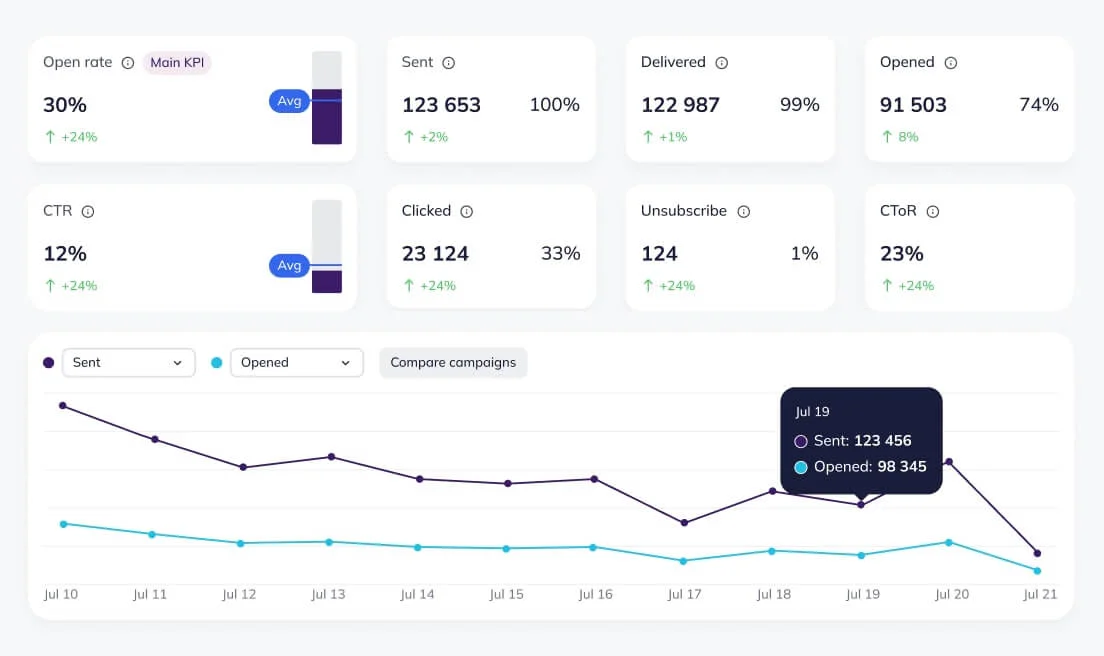
Here’s an example of an email marketing dashboard:

Why tracking your email campaigns matters
Email marketing is evolving rapidly, it’s no longer just about sending a newsletter once a month. Campaigns of 2025 involve personalization, segmentation, and customer journeys across different touchpoints. If you’re not tracking your campaigns meticulously, it’s almost impossible to know if your emails are doing their job. Not tracking emails also means potentially losing money and opportunities for performance improvement. Email marketing dashboards can help you stay on top of all the moving parts, so that you don’t need to do any guesswork.
Benefits of using an email marketing dashboard
It’s easy to get lost in numbers when running one email campaign, let alone several. A good email marketing dashboard brings everything together, helping you see the full picture without getting overwhelmed. Here are a few advantages of using one:
- Save time. Instead of having to jump between different tools or reports, you can see all of your important metrics in one place, i.e., on your dashboard. It keeps your workflow smooth and lets you focus more on things that matter, like email marketing strategy.
- Spot problems early. With a dashboard, you can catch potential issues early on — for example, a sudden drop in open rates or an unusually high bounce rate. It allows you to act quickly, meaning you miss fewer opportunities.
- See what works. It’s easier to spot which emails, subject lines, or audience segments are performing best if you have a clear view of all of your results.
- Share results easily. If you need to report to a manager, client, or your whole team, a dashboard makes it easy to show how your emails are performing. No need for 10-page reports or millions of slides!
- Improve over time. Dashboards make it simple to compare campaigns over time and spot patterns you might miss otherwise. This means you can learn from your past performance and make your future campaigns better.
If you’re already using Selzy for your email marketing needs, you’re in luck — we have a great email marketing dashboard, too. Selzy’s email marketing dashboard lets you monitor key metrics like sent emails, delivery rates, opens, clicks, unsubscribes, and even spam complaints in real time. In addition to this, you can view detailed campaign reports, track your performance over time, and even compare them to one another.
Selzy’s email marketing dashboard also offers visual analytics, click statistics, and mobile optimization insights. Don’t forget to make use of our built-in automation and AI tools! Best of all, you can access all these features even on the free plan.
Even if you’re not going to use Selzy’s marketing dashboard, we recommend you continue reading this article — there’s plenty of useful info for everyone.
Email marketing dashboard examples and templates
A dashboard should match the decision you need to make. A marketing manager, an agency, and an e-commerce team may all track email performance, but they usually need different views. Use these examples as a starting point for your own dashboard structure.
| Dashboard type | Best for | Key widgets and KPIs | Data sources | Review cadence |
| Campaign performance dashboard | Checking how one campaign performed after send | Delivered emails, opens, clicks, CTOR, unsubscribes, bounces, spam complaints | ESP campaign reports | 24-72 hours after launch, then after the campaign closes |
| Executive overview dashboard | Sharing email performance with leadership | Campaign volume, total clicks, conversions, revenue, ROI, list growth | ESP, CRM, e-commerce platform, analytics tool | Weekly or monthly |
| Revenue and ROI dashboard | Understanding how emails contribute to sales | Orders, revenue per campaign, conversion rate, revenue per subscriber, ROI | ESP, Google Analytics, CRM, e-commerce platform | Weekly, monthly, and after major promotions |
| List health dashboard | Keeping the audience clean and engaged | List growth, inactive subscribers, unsubscribes, hard bounces, spam complaints | ESP list and contact data | Weekly or monthly |
| Deliverability dashboard | Spotting inbox placement and sender reputation issues | Delivery rate, bounce rate, spam complaint rate, domain or segment-level trends | ESP, deliverability tools, authentication checks | Before and after large sends |
| Automation and journey dashboard | Improving welcome, nurture, reactivation, and abandoned-cart flows | Flow entry, completion, opens, clicks, conversions, revenue by step | ESP automation reports, CRM, store data | Weekly during optimization, monthly after stabilization |
| Agency or client reporting dashboard | Showing progress across multiple brands or accounts | Campaign comparison, goal progress, top campaigns, issues to fix, next actions | ESP accounts, BI tool, spreadsheet, client CRM | Weekly or monthly, depending on the retainer |
If you are building a template from scratch, keep the first view focused on the decision maker. A specialist may need detailed campaign and segment breakdowns, while a founder or client usually needs a concise summary of performance, revenue, and next actions.
Key metrics and KPIs to track
To make the best use of your email marketing dashboard, you need to know what metrics actually matter. Tracking the right numbers helps you understand how your campaigns are performing and where there’s room to improve. If you have the raw data from your email platform, you can actually calculate most of these metrics by hand using formulae, but dashboards can save you time by doing all the maths for you.
What to do when a dashboard metric changes
A dashboard becomes more useful when each metric points to a next step. Use this quick troubleshooting view to connect changes in performance with practical actions.
| Metric change | What it may mean | What to check next |
| Open rate drops | Subject line, sender reputation, send time, or audience relevance changed | Review subject lines, segments, authentication, and recent deliverability issues |
| CTR or CTOR drops | The offer, content, or CTA did not create enough intent | Check the main CTA, link placement, landing page match, and audience segment |
| Bounce rate rises | List quality or acquisition source may be weakening | Separate hard and soft bounces, clean invalid addresses, and review recent imports |
| Spam complaints rise | Subscribers did not expect, recognize, or value the email | Pause risky segments, check opt-in source, reduce frequency, and clarify unsubscribe paths |
| Revenue is flat despite clicks | The campaign creates interest but not enough purchase intent | Review offer relevance, landing page speed, checkout path, and attribution setup |
Open rate
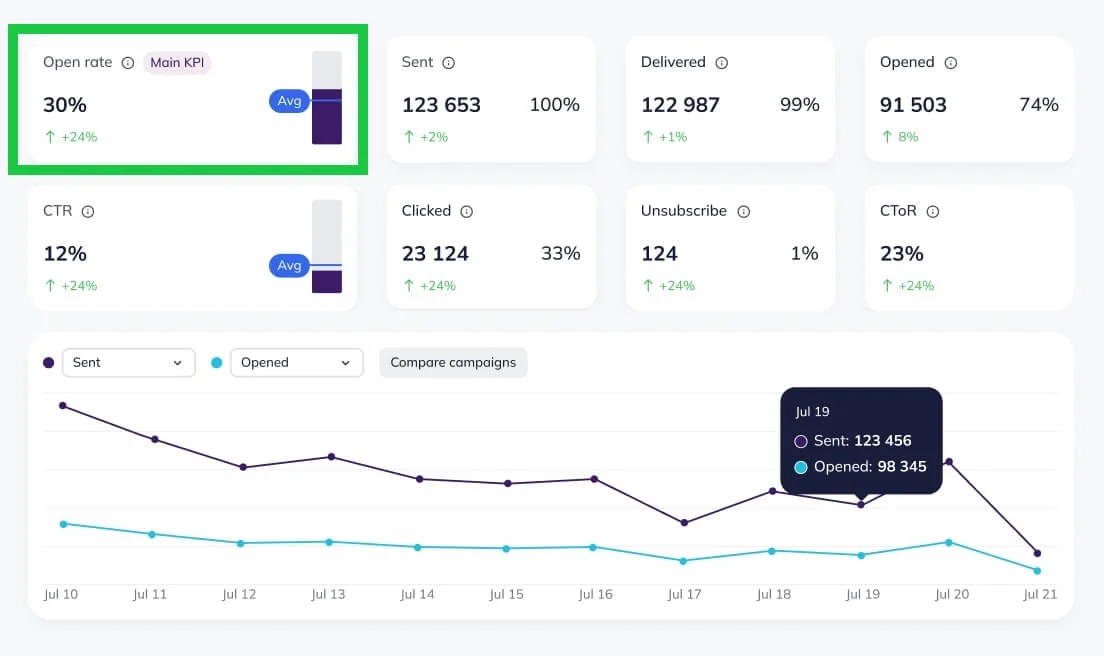
Your open rate shows the percentage of people who opened your email out of everyone you sent it to.
It’s one of the first signs that your subject lines and timing of your emails are doing their job. If your open rate is low, it may mean that your subject line didn’t pique the recipient’s interest, or, worst of all, that your email landed in their spam folder.
If you’re tracking several campaigns at the same time, your open rate stats may look like this:
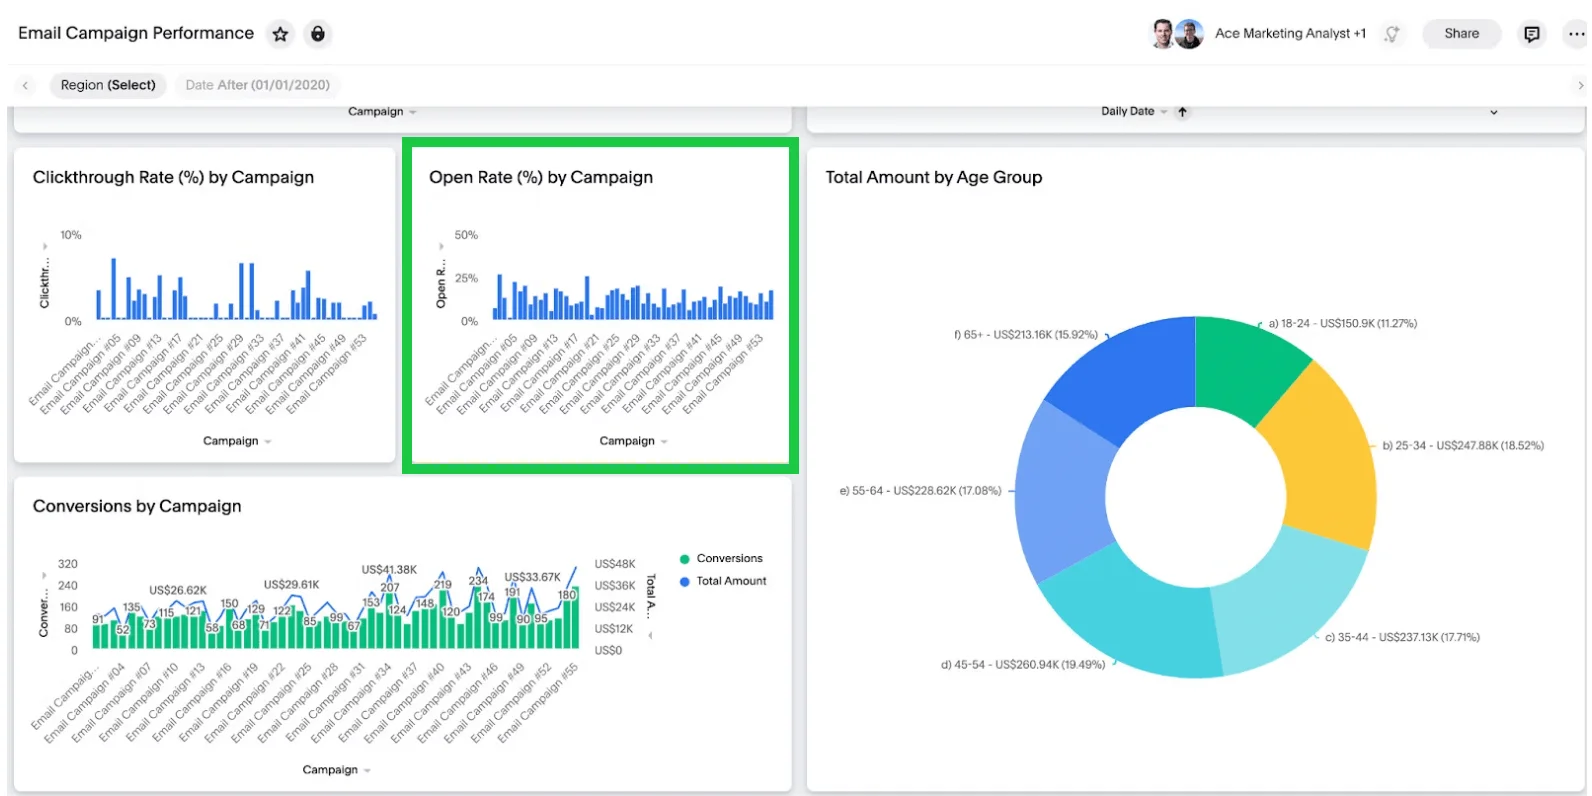
Here’s something to consider, however — even though open rates remain an important metric, they’re becoming less and less reliable. This is due to privacy features on different devices and operating systems that can block or fake opens tracking. This means that it’s important to look at other metrics too, so keep reading!
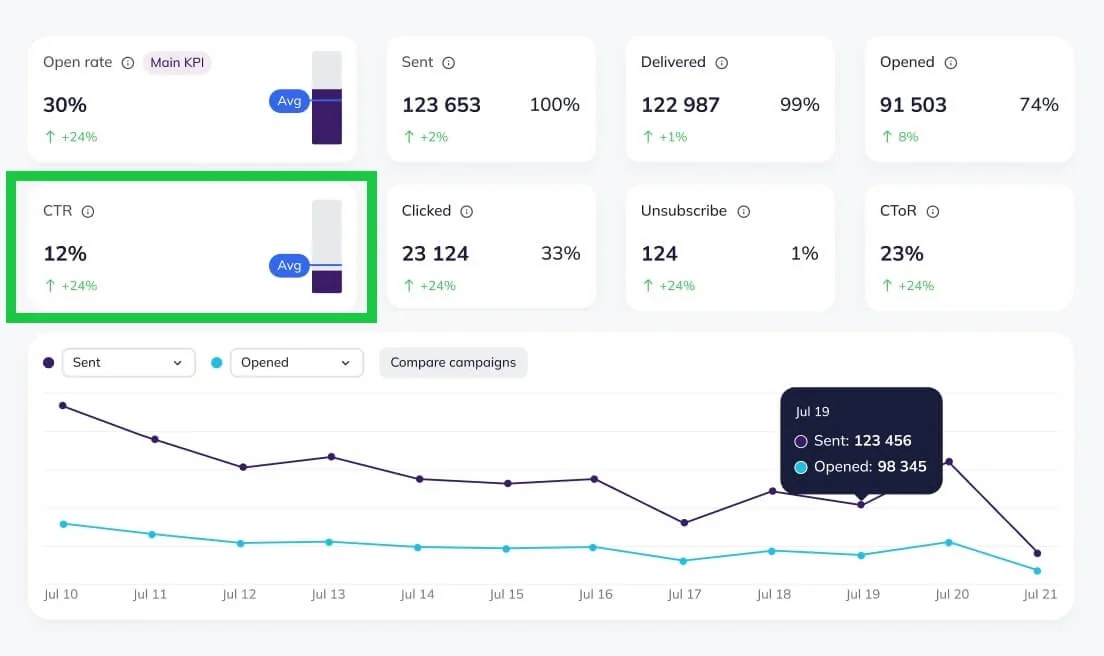
Click-through rate
Click-through rate tells you how many people clicked on a link inside your email compared to how many received it.
Your CTR is a good sign of how engaging the content of your email is. If your CTR is low, it might mean your call-to-action isn’t clear enough, or your email content isn’t convincing people to click.
Click-to-open rate
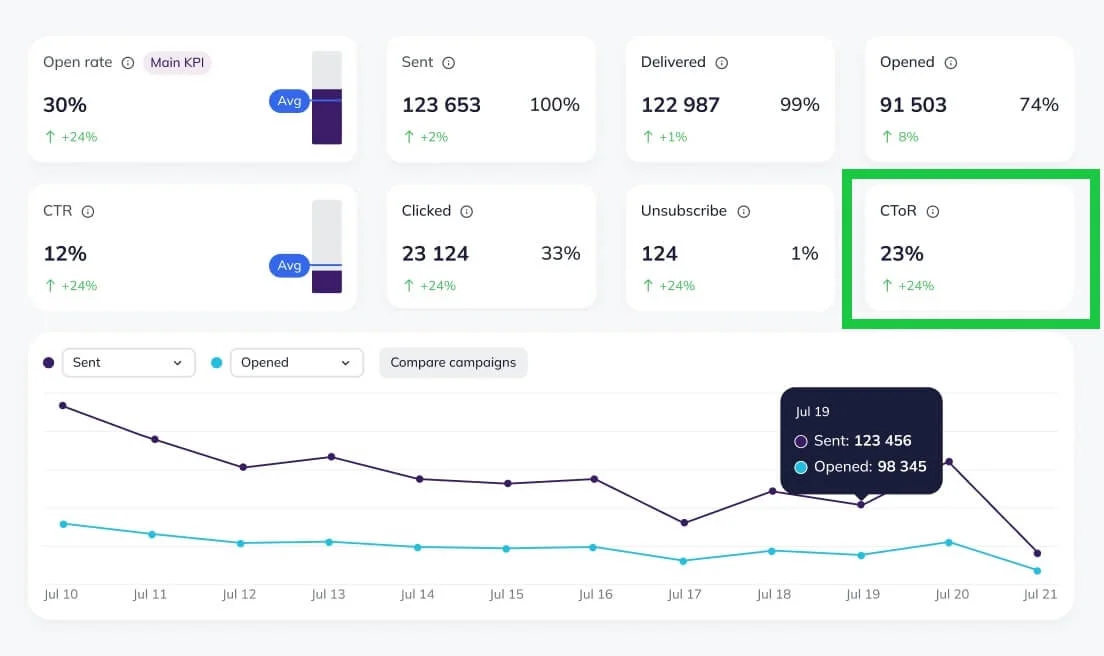
The term click-to-open rate (CTOR) sounds pretty similar to CTR, but they’re actually a bit different! Click-to-open rate shows how many people clicked a link after opening your email.
The difference between CTR and CTOR is that CTR measures clicks after receiving the email, while CTOR measures clicks after opening it. When thinking about CTR, you’re asking yourself, “Of everyone I emailed, how many clicked?” whereas with CTOR, your question is, “Of people who opened, how many clicked?”
CTOR is an important metric because it tells you how well your email content is performing after someone opens it. A good CTOR means your content and call-to-action are strong and convincing. If you have a good open rate, but your CTOR is low, it may mean that people are curious about your email initially, but lose interest once they’ve actually opened it.
Conversion rate
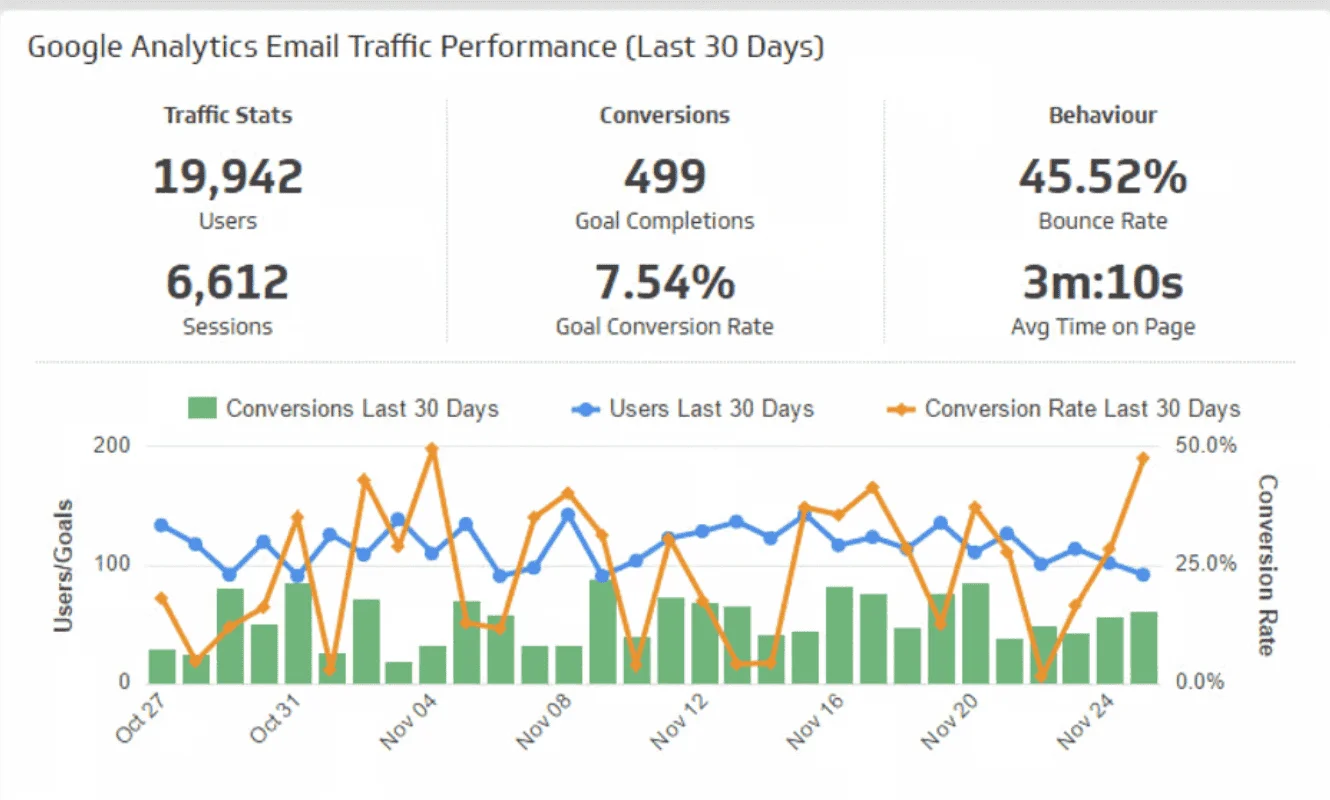
Conversion rate measures how many people completed a desired action after clicking your email. What is this desired action, you ask? It can be anything, like making a purchase, subscribing to a newsletter, or downloading a guide. It depends on your specific marketing goal for the email you’re sending.
Conversion rate is one of the most important metrics because it shows whether your emails are actually driving results, not just getting clicks. If your conversion rate is low, it may mean the content of your email is fine, but the problem lies with your landing page, for example.
To get the complete picture of your conversion rate, you need to track how users are behaving on your website. This usually means setting up website analytics with a tool like Google Analytics. You can connect your email service provider, such as Selzy, to Google Analytics to see how users behave after they’ve clicked on your email.
List growth rate
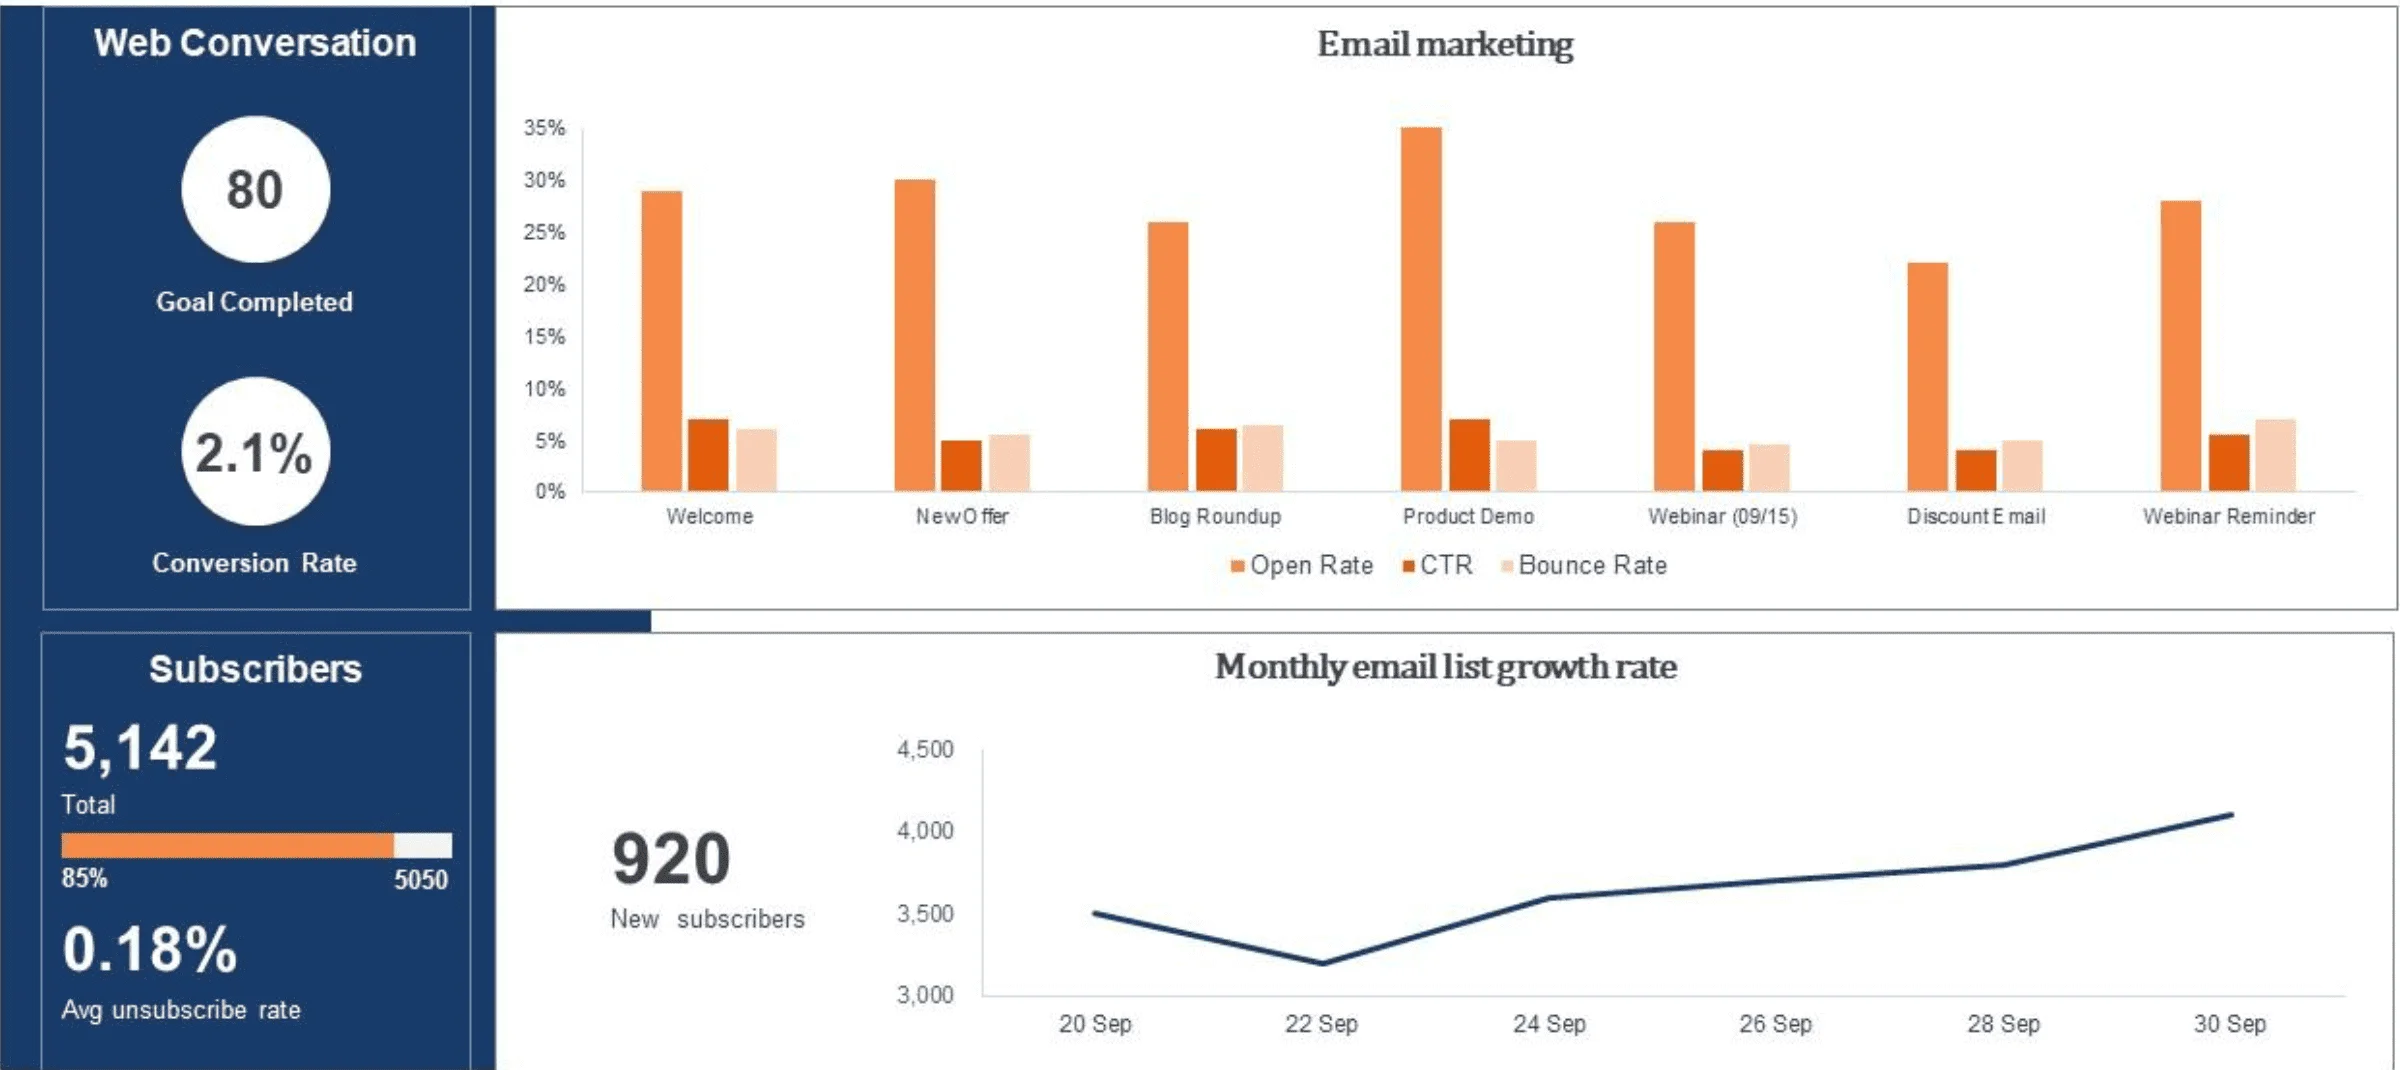
The name here is pretty self-explanatory — your list growth rate tells you how quickly your email list is expanding over time. List growth rate looks at how many people subscribed to your list, but also how many people you lost, such as those who unsubscribed, or invalid email addresses that bounce back.
Basically, the aim of this metric is to show you how your audience is changing. To keep your email marketing efforts sustainable over time, you need a strong list growth rate — meaning you’re attracting new people faster than you’re losing them.
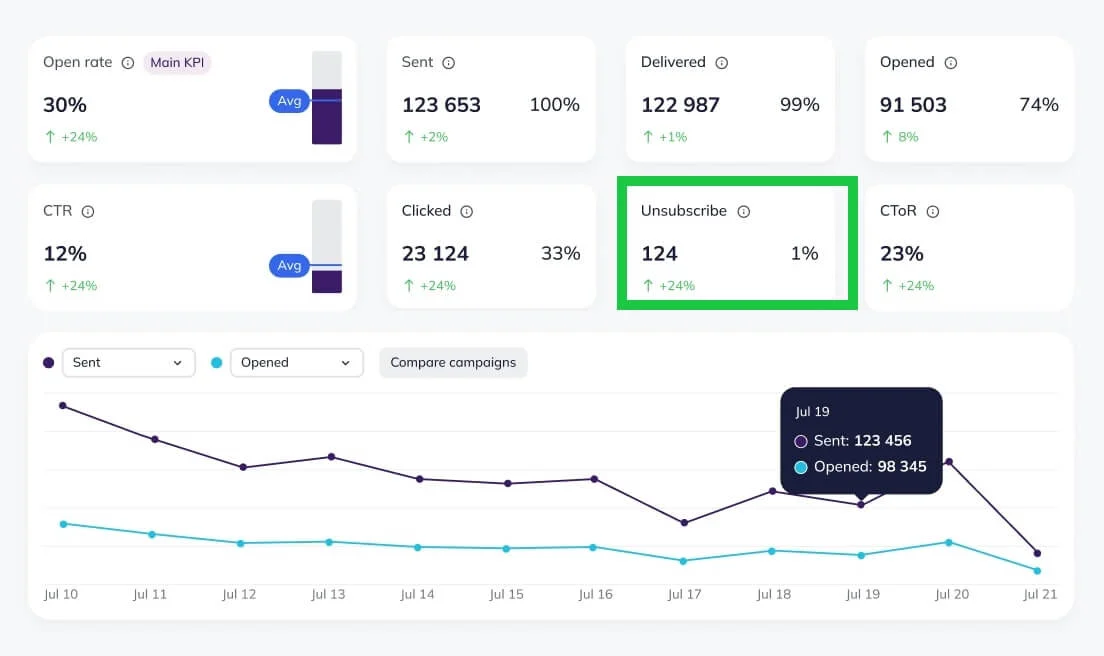
Unsubscribe rate
Again, you can probably guess what the metric here is from its name. Unsubscribe rate measures the percentage of people who opted out after receiving a specific email.
We just mentioned that unsubscribes are part of your overall list growth rate, so you may be wondering why they warrant their own metric, too. The reason is that the list growth rate shows the big picture over time, while the unsubscribe rate gives you immediate feedback on how a specific email performed. For example, a sudden spike in unsubscribes can be a warning sign — it may mean that your content didn’t match expectations, you’re emailing too often, or the message wasn’t relevant.
Bounce rate
In email marketing, a “bounce” means your email failed to reach someone. Bounce rate shows the percentage of emails that couldn’t be delivered to your subscribers.
There are two ways your emails can bounce. A “soft bounce” is a temporary delivery issue. It can happen when the recipient’s inbox is full or their server is down. When your email bounces softly, it’s sometimes possible to resend it later and reach the recipient. A “hard bounce” means permanent failure, usually because the email address doesn’t exist or is invalid. If you want to protect your sender reputation (and you should!), remove these email addresses from your list straight away.
It’s important to track your bounce rates because if they’re high, it can hurt your email deliverability. If too many of your emails bounce, email providers might start marking your messages as spam.

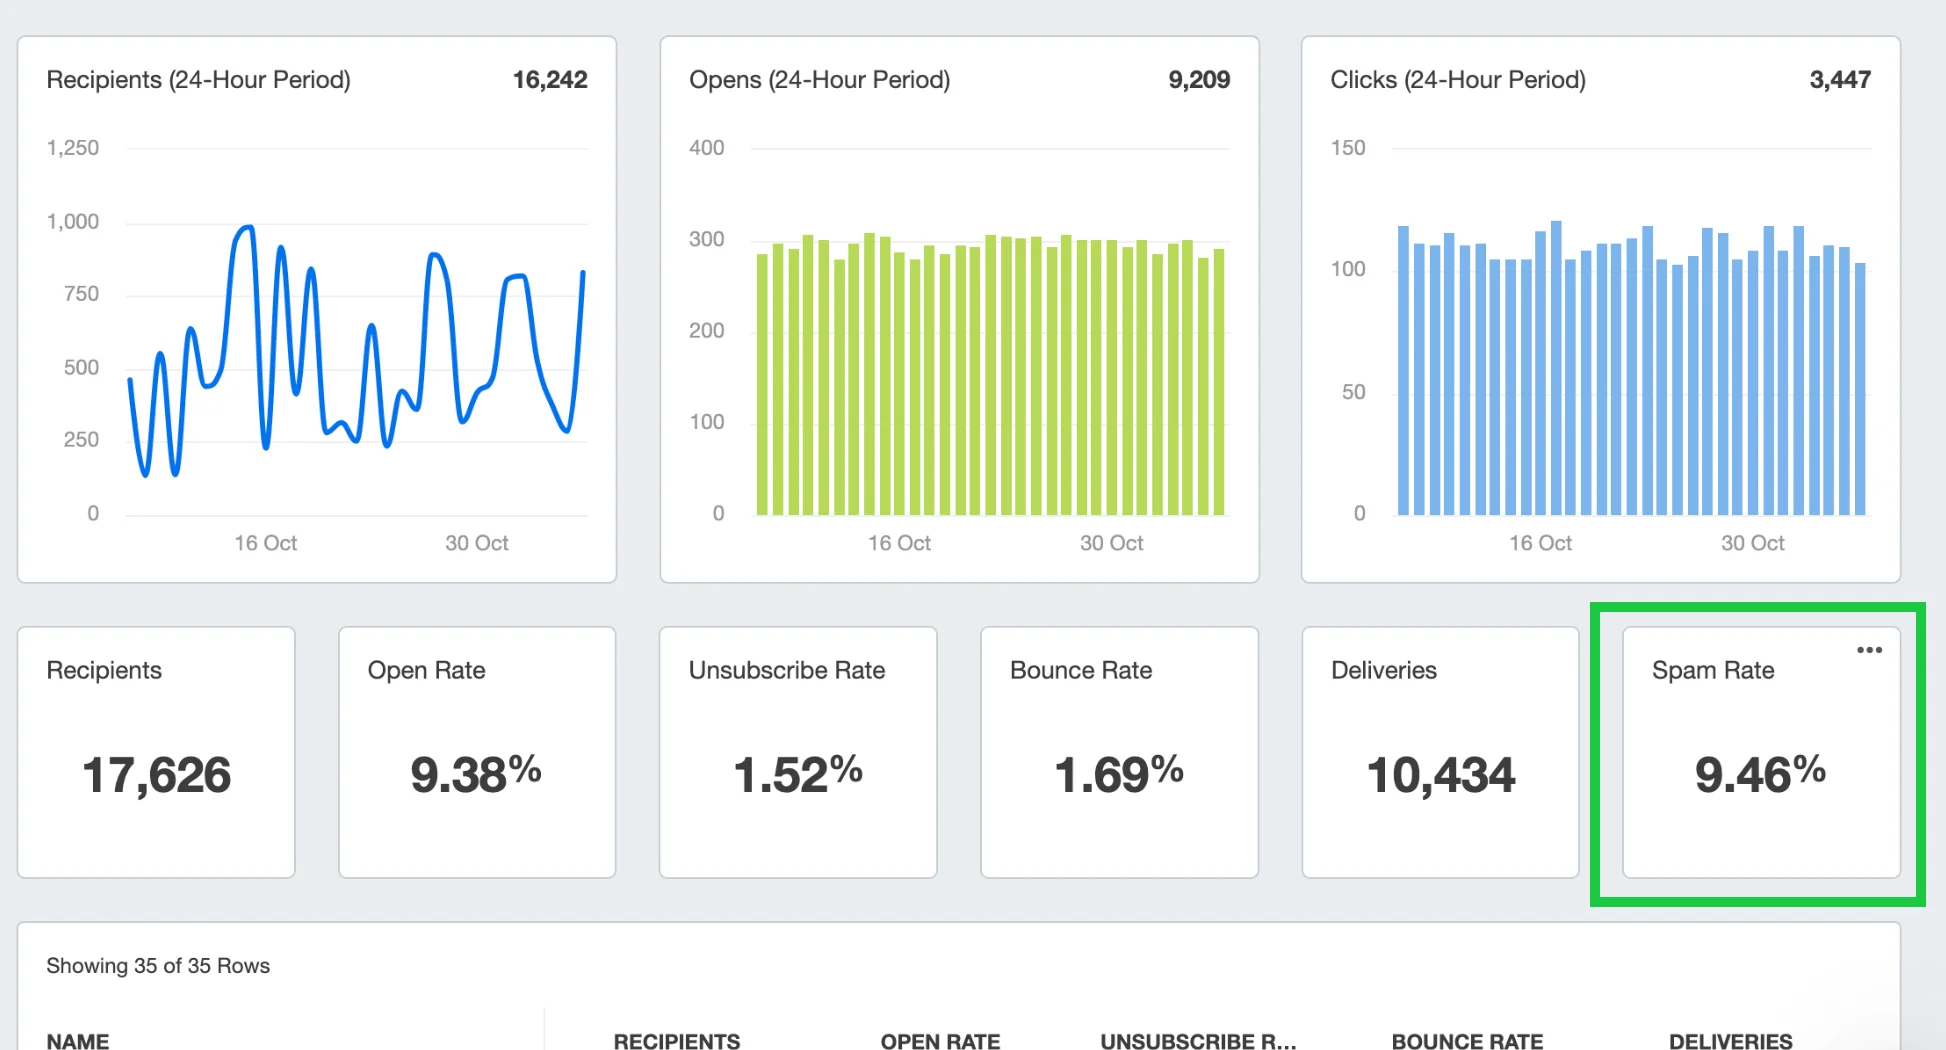
Spam rate
Spam complaint rate shows the percentage of people who marked your email as spam after receiving it. This is very serious — even a small number of complaints can hurt your sender reputation.
If people feel annoyed or misled by your email, or when they receive something they didn’t ask for (for example, if they didn’t subscribe to your emails), they’re likely to mark it as spam. Even if you didn’t mean to cause it, unwanted communication can lead people to hit the spam button fast. If you see on your dashboard that you have a sudden spike in spam rates, this means that something went wrong, like sending too many emails, targeting the wrong audience, or using unclear messaging.
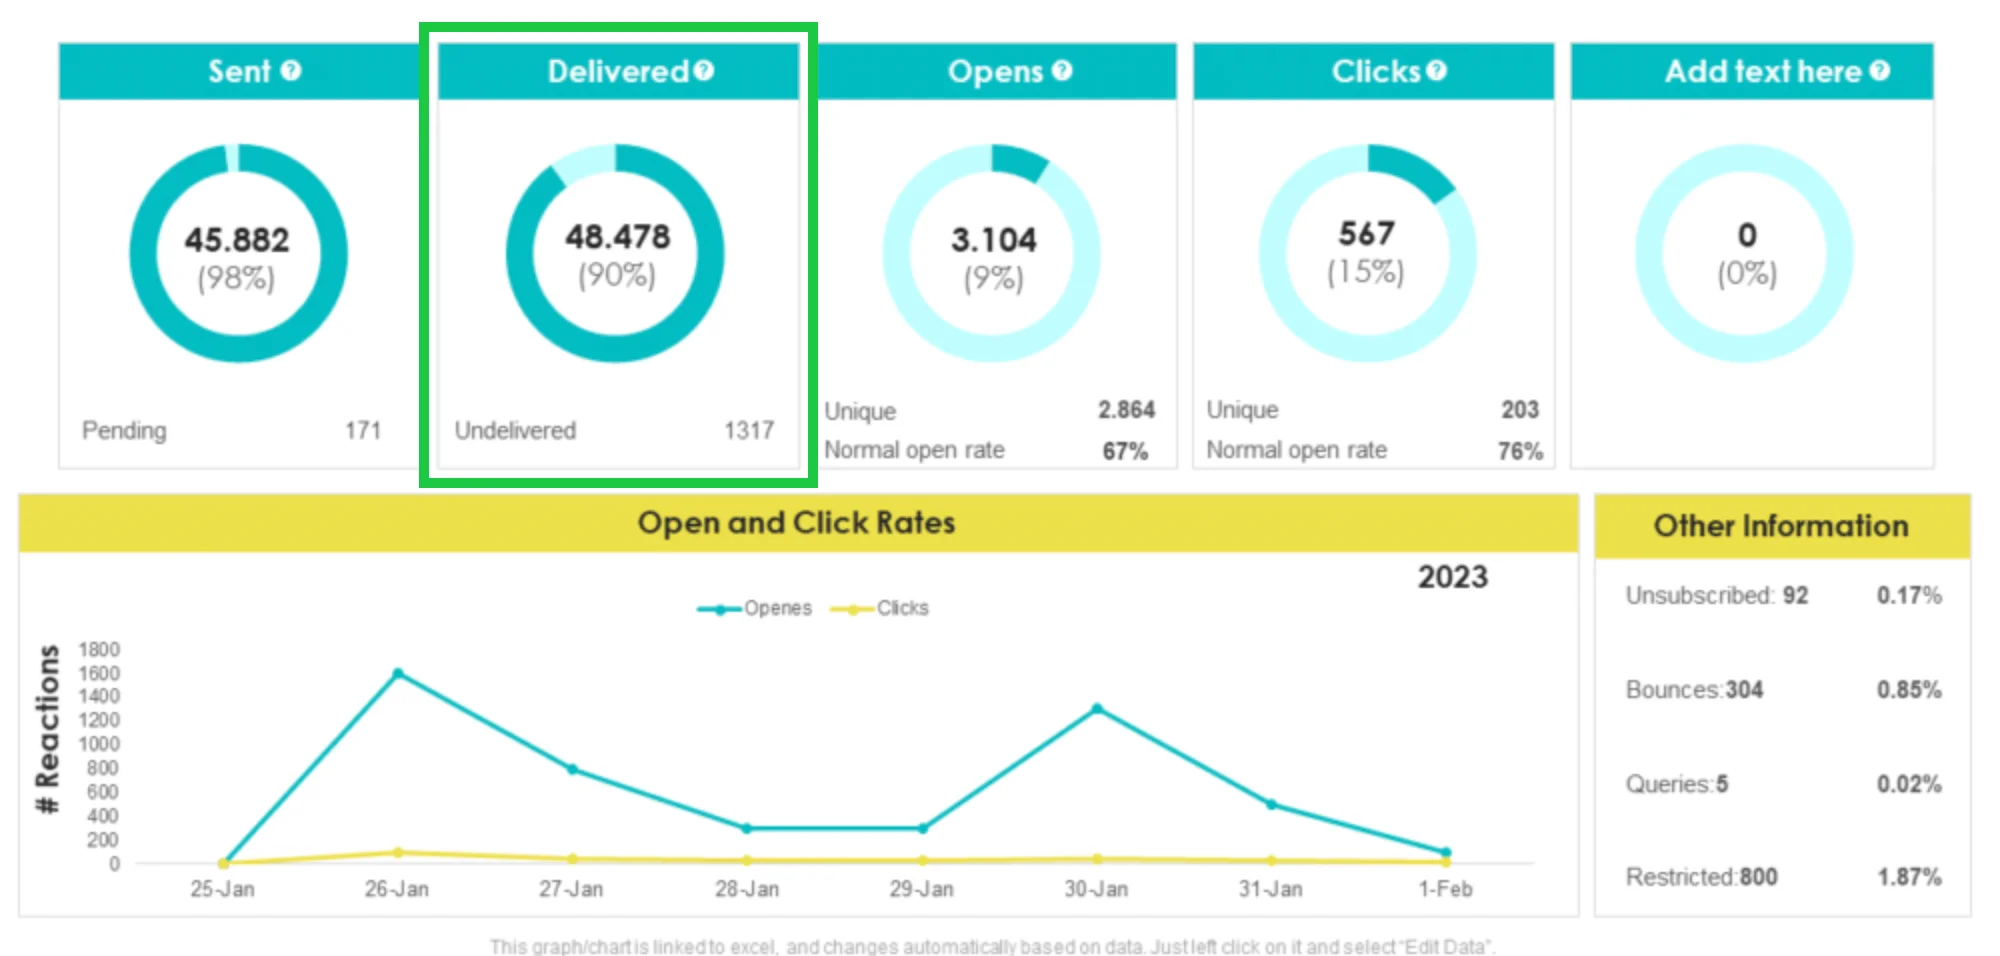
Deliverability rate
Deliverability rate shows the percentage of emails that were successfully delivered to your subscribers’ inboxes. A healthy deliverability rate usually means your list is clean, your sender reputation is strong, and email providers trust your messages. If the rate drops, it could point to issues like high bounce rates, spam complaints, or low-quality email lists.
Revenue and ROI
Revenue shows how much money your email marketing campaigns are generating. This could be from a single campaign or across all your email marketing efforts. Some dashboards also show the number of orders (or purchases) generated by your emails, alongside the total revenue earned. You can also break it down even further, such as revenue per email or revenue per subscriber, to see exactly how much each message or contact is worth.
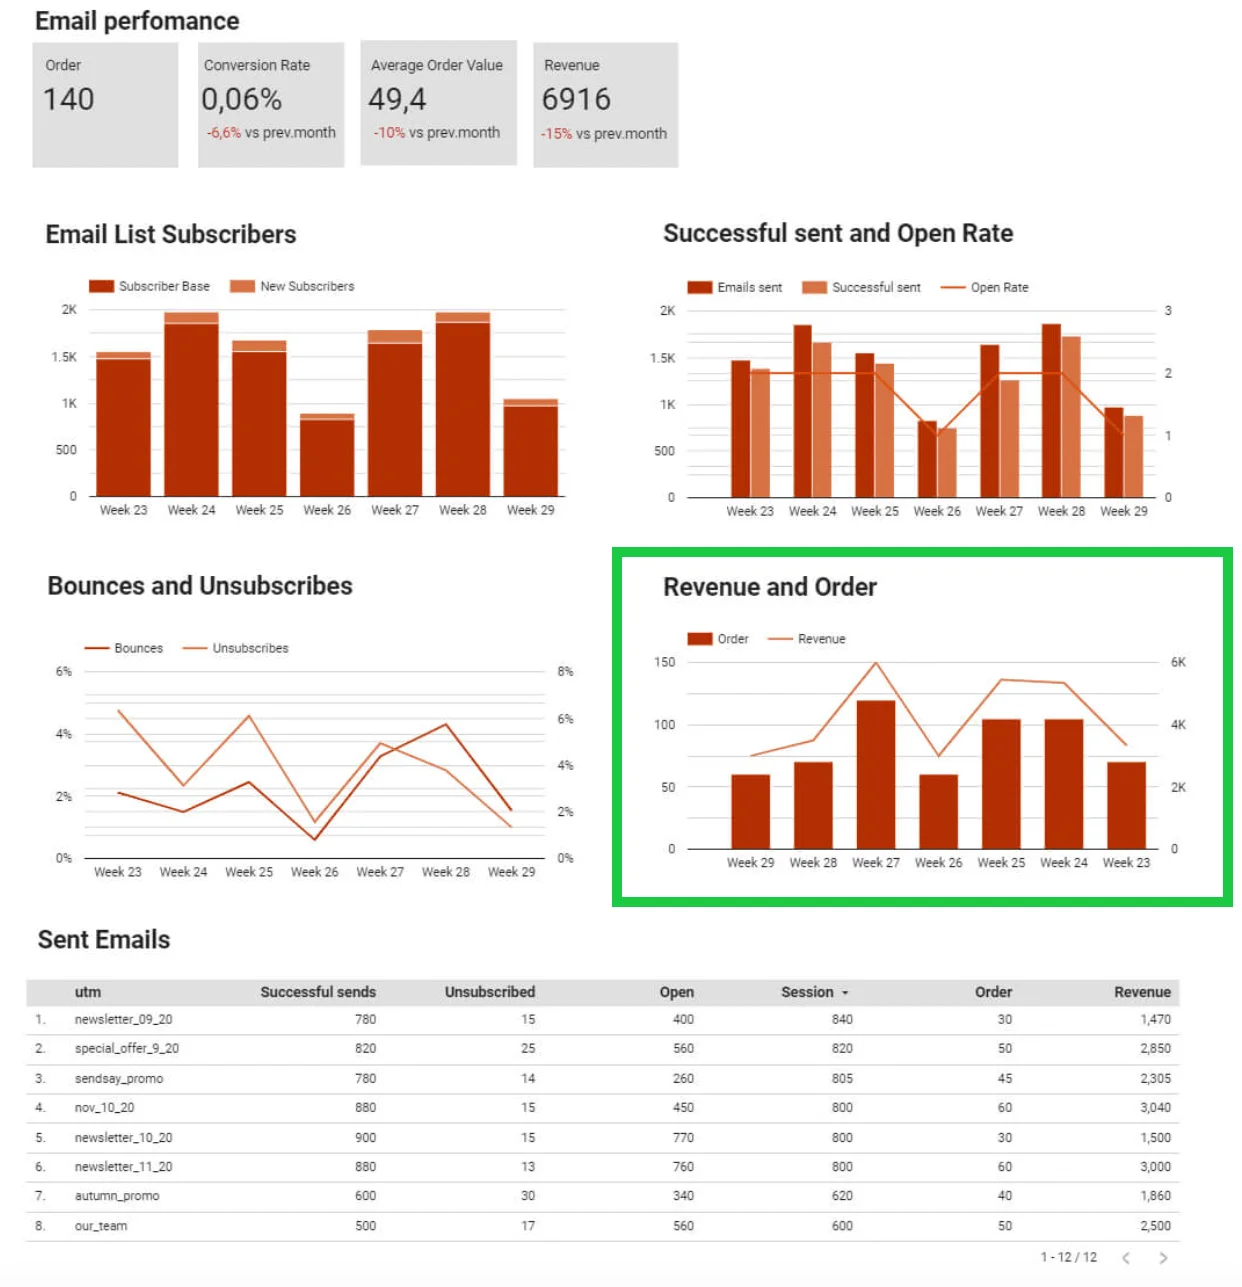
ROI (return on investment) metric takes it a step further. It compares the money you earned to the money you spent running your campaigns, including costs like design, tools, and ads.
Choose the right dashboard setup for your team:
- Use your ESP dashboard for everyday campaign monitoring, quick comparisons, and list health checks.
- Use a BI tool or Looker Studio when you need to combine email data with website, CRM, and e-commerce data.
- Use a CRM or e-commerce dashboard when revenue attribution, customer lifecycle stage, or purchase history is the main question.
- Use a spreadsheet only for lightweight reporting or one-off analysis, not for real-time monitoring.
Whatever tool you choose, define who owns the dashboard, how often the data refreshes, which segments matter, and which filters should be available. Without those rules, even a beautiful dashboard can become another report nobody acts on.
Best practices for building an email marketing dashboard
If you’re just starting out, we recommend using the dashboard in your email service provider. But if you’ve gotten used to it and want to track more metrics, you can set up your own email marketing dashboard. Here are some best practices to help you build a dashboard that actually works.
Define clear goals
Before you begin doing anything dashboard-related, ask yourself what you want to achieve. What are you trying to improve, exactly? Are you looking to boost open rates? Drive more sales from your emails? Reduce unsubscribes?
Don’t just throw data at your dashboard for the sake of it, try to use the info that would reflect your main goals and success indicators. Once you decide on that, you’ll be able to pick the metrics you need.
Integrate data from all key sources
As you already know, most dashboards pull data directly from your email service provider, but they can also connect with other tools like CRM systems or website analytics platforms via their integration features.
You can track the full customer journey by bringing together data from tools like Google Analytics, your CRM, and even your e-commerce platform. Just make sure all your tools can actually talk to each other. Before committing to any platform, check that your email service provider, CRM, analytics tools, and dashboard software can integrate smoothly, it’ll save you a lot of time and headaches later.
Use a clear layout
Yes, we’ve covered a lot of metrics in this article. But it doesn’t mean that you need to have every single one of them on your dashboard. The best dashboards are focused and easy to scan and analyze. Depending on your goals, choose a few key metrics to highlight first. When thinking of your layout, remember the goals you outlined. What do you want to know first? What follow-up questions might you have?
This doesn’t mean you can’t include additional data in your dashboard. Make it easy to access through dropdowns, tabs, or filters. This way, you can keep the main view clean without losing access to deeper insights.
And don’t overload your dashboard with a dozen graphs or a rainbow of colors, that only makes it harder to focus. Stick to clean visuals, a limited colour palette, and consistent formatting.
Use predictive analytics
Once your dashboard is up and running, you can see information about everything that’s already happened in your campaign. Would you like to start seeing what’s likely to happen next? This is the job of predictive analytics — these are the tools that help you forecast future results, like open rates, conversions, or changes in your list size, based on past data.
Some email service providers offer their own predictive features. If yours doesn’t, don’t worry — you can still integrate with external tools that specialize in this kind of analysis, like Google Looker Studio, Tableau, or Power BI.
Monitor and refine
Your dashboard isn’t just a one-time setup, it requires regular tailoring. Keep an eye on how your key metrics are performing, and look for patterns or changes that might need action. Use your dashboard to spot trends like dropping open rates or flattening conversions, early.
One of the best ways to test improvements is through A/B testing (also known as split testing). With Selzy, you can easily compare different versions of your emails, like varying subject lines, content, visuals, or send times, and track results in real time. The dashboard breaks it down by opens, clicks, opt outs, and more.
FAQ about email marketing dashboards
What is an email marketing dashboard?
An email marketing dashboard is a tool that brings your email marketing analytics together in one place. It helps you track important metrics, spot trends, measure results, and see how your campaigns contribute to larger marketing goals. It can cover overall performance or focus on a specific campaign.
What should I include in an email marketing dashboard?
Include the key email metrics that show how campaigns are performing, such as results for opens, bounces, and other important campaign data mentioned in your email platform. A good dashboard should also be able to pull data from your email service provider and, if needed, connect with CRM or website analytics tools for a fuller picture.
How is a dashboard different from a report?
A dashboard is designed to show your marketing data in one place so you can monitor performance quickly and adjust your strategy as needed. A report is usually more static, while a dashboard helps you keep an ongoing view of what is working and what needs fixing.
What are the first KPIs I should check in an email marketing dashboard?
Start with the metrics that show whether your campaigns are being delivered and engaged with, such as open rates and bounce rates. These are useful early indicators because a sudden drop in opens or a rise in bounces can signal a problem that needs attention.
How often should I review my email marketing dashboard?
Review it regularly so you can catch issues early and avoid guesswork. Frequent checks help you notice changes in performance, such as drops in open rates or other campaign issues, before they affect more results.
Does Selzy have an email marketing dashboard?
Yes. Selzy lets you send mass emails, use automation, and easily see your results in one place. The platform also includes an AI email builder and 24/7 support.
Conclusion
Don’t think of your email marketing dashboard as a bunch of graphs and numbers — it’s your go-to tool for understanding what’s working, what’s not, and where to go next. Set clear goals, define your most important metrics and keep your layout focused — that’s all there is to building a dashboard that actually helps you improve performance instead of just reporting on it.
 New and noteworthy on our blog
