


Marketing is to some extent intuitive — you come up with an idea and run a campaign to see if it works. But experimenting on the entire contact list might be detrimental to your campaign — you might waste the marketing budget and subscribers. How can you get more control over your campaign metrics and increase the efficiency of your emails?
Read this article and learn all you need to know about email A/B testing.
What is A/B testing in email marketing
Imagine that you went to a fancy hair salon with the best colorists in your area and asked a hairdresser to go from pitch black to platinum blonde. Even experienced specialists can’t fully predict the results. That’s why your stylist first applies bleach to a test strand of your hair. If the outcome is not desirable, you still have (most of) your hair and a stylist still has a chance to give you that blonde you want.
The same goes for email marketing. Even if you’re an experienced marketer, you can’t 100% predict your campaign’s efficiency — but you can verify hypotheses with A/B testing.
A/B testing, or split testing, is the process of sending two slightly different emails to two subscriber groups, comparing email metrics, and choosing the email version that works best.
Why you should start A/B testing your emails ASAP
Running tests on every email seems to be a handful — why should you bother? Here are three benefits of A/B testing that are even applicable to automated campaigns.
Boost your campaign’s efficiency
The benefits of A/B testing have been recognized in many fields — for example, UX/UI design. For example, startups that continuously run tests on web pages, have 30–100% more visits over one year compared to those who don’t. And when it comes to email marketing, A/B testing does much more than increasing clicks and views — companies that test emails have a 37% higher ROI.
A/B testing leads to higher conversions and wiser marketing budget use — instead of blindly sending out emails that might not work, you’ll get the best results with what you have in store.
Trust the numbers
A/B testing is quantitative research — that’s why its results are accurate, reliable, and leave less room for subjective interpretation. This implies that testing your emails allows you to assess your campaigns’ efficiency and set realistic goals in the future.
Get closer with your target audience
A/B testing shows what your subscribers engage with more — so you can learn more about the values and interests of your target audience. It means that testing just one email gives you information for future campaigns.
For example, you tested two CTAs — “Don’t miss this out” and “Get my free trial”. The first one uses the sense of urgency and it yielded more clicks. It means that your subscribers are prone to FOMO. You can use this information for the next sales campaign — and not just for CTAs but also for subject lines and other elements. In the end, the data you get during each A/B test gives you a firmer baseline for content ideas.
Email components you can test
The short answer to “What can you test?” is everything — even the smallest tweaks can make a huge difference. Let’s take a look at the most common A/B testing variables in email marketing.
Sender name
Just like email subject lines, sender names are the first thing subscribers notice when they check their inboxes. That’s why your sender name should be recognizable and resonate with the audience. Many companies use brand names as sender names — but it’s not the only option and it doesn’t work for all businesses and campaigns. Here are some sender name templates you can experiment with:
- Brand name + “team”, like “MyBrand Team”
- Brand name + content type, i. e. “MyBrand News”
- Brand name + person, as in “Erica from MyBrand”
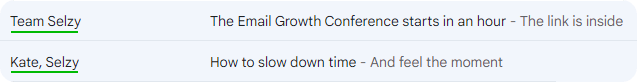
Here’s how we use these different approaches to sender names in our own emails. As you can see, we use personal names for personal emails with educating or entertaining content. And the “Team Selzy” sender name is better for business emails and formal notifications.
Aside from comparing these options, you can also choose one option and test its two variations. For example, you might find out that female names generate a higher open rate than male names or vice versa.
Subject lines
Email subjects are probably the most popular A/B testing variable — 47% of marketing specialists test them before sending emails. The opportunities for testing and optimizing here are endless — here are some email subject line variations for your research:
| Parameter | Version A | Version B |
| First name vs. full name | Alan, we got you a gift! | Alan Smithee, we got you a gift! |
| Emojis | 🎉 Alan, we got you a gift! | Alan, we got you a gift! |
| Personalization | Alan, we got you a gift! | We got you a gift! |
| Urgency | Alan, hurry up and take your gift! | Alan, we got you a gift! |
| ALL CAPS | Alan, get your gift before it’s too late! | Alan, get your GIFT before it’s TOO LATE! |
| Punctuation | Alan, we got you a gift. | Alan, we got you a gift! |
| Intrigue | Alan, click to get a surprise! | Alan, click to get your $100 Amazon gift card! |
| Action words | Alan, your gift is waiting for you | Alan, get your Amazon gift card |
| Questions | Alan, we got you a gift! | Alan, guess what we have for you? |
This is not the full list of subject line variables you can test — but these are the most common parameters for optimizing email subjects. Aside from that, you can also play around with jokes, tone of voice, and other characteristics.
Preview text
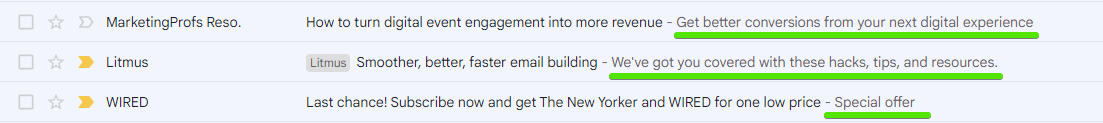
Preheader, or preview text in email is a short email description that recipients see next to the subject line. It looks like this:
The most common parameter for preview text testing is its length. For example, here’s the test done by Yesware:
Their test showed that a shorter preview text generated a higher open rate probably because it displayed correctly on mobile devices. However, it’s not the universal pattern. Optimizing preview texts includes shortening them but yours might have more than one sentence — unlike this example — and still be more effective for your campaign and your audience. After all, that’s why you need A/B tests — to find out what works best for your specific case.
Copy
An email copy is a little tricky to use as an A/B test variable. Unlike subject lines, it’s not a subtle detail you can tweak — it’s a larger entity. But at the same time, content copies provide a lot of room for experimentation. The simplest variable you can test is the copy’s length, comparing CTRs of long and short copies. But you can also experiment with:
- Tone-of-voice
- Active vs. passive language
- Positive vs. negative language
- Emojis
- The copy’s structure: paragraphs, headers, etc.
- Jokes and puns
- Hyperlink placements
- Different variations of greetings and sign-offs
Take a look at this example:
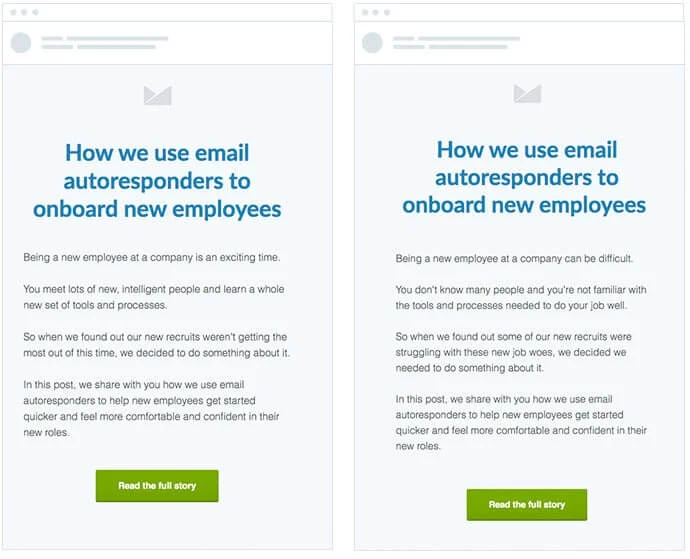
CTAs, headers, the email design, and the topic are identical in both variations. The only thing that’s different is the use of positive and negative markers. The copy on the left describes opportunities, the other copy describes adversities of onboarding new employees.
HTML vs. plain text
Plain text emails are usually associated with personal or business correspondence. This type of email doesn’t allow bright designs, layouts or a decent variety of email fonts. And, if used for marketing purposes, the default look makes CTAs less noticeable — like this:
And here’s an example of a basic HTML sales email — it has images, a CTA button, and an interesting layout:

Why even consider plain text emails as an option when HTML emails are more appealing to the reader and offer more flexibility? The silver lining is that plain text emails look less “salesy” — and sometimes you want exactly that. For example, the main objective of automated delivery notifications is to inform, not persuade. That’s why HTML emails with bright designs might be a little excessive for such purposes.
Automation timing
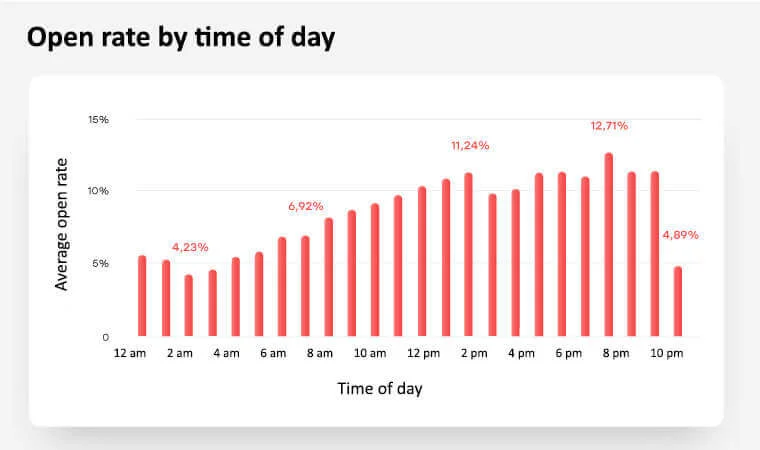
According to our study, emails get the highest open rates if they’re sent around 8 pm.
The extensive study by GetResponse provides conflicting data for different regions. For example, according to this research, the emails sent at 6 pm generate the highest open rates in the Asia-Pacific region. Same goes for days of week — the most effective days for deploying a campaign are not the same across the world.
The thing is, there are many studies on the matter — but all this data can only be used as advice, not a definitive guide. Sending time depends on your target audience and market niche. That’s why the only way to find out what works for you is testing.
Personalization
Almost 60% of email marketers consider personalization one of the best ways to improve engagement. There are many personalization tactics you can use aside from using recipients’ names in subject lines, which include:
- Location-based suggestions
- Adjusting sending time to different time zones
- Recommendation based on customer behavior, i. e. viewing and purchase history
- Recommendations based on gender, age, occupation, and other demographic data
- Birthday gift suggestions tailored to certain customer groups
- Email activity-based re-engagement emails
A/B testing is a great opportunity to experiment with different personalization tactics and recommendation algorithms. For example, imagine that you write a newsletter for a music streaming service that recommends new releases. You can send two versions of the same email — one with recommendations based on the last month’s listening statistics and the one considering the last three months.
Visuals
When it comes to email design, feel free to use any element for A/B testing. Fonts, different layouts, color schemes, the use of GIFs, photos, and videos, and testing different imagery to assess how your subscribers respond to them — there are many opportunities.
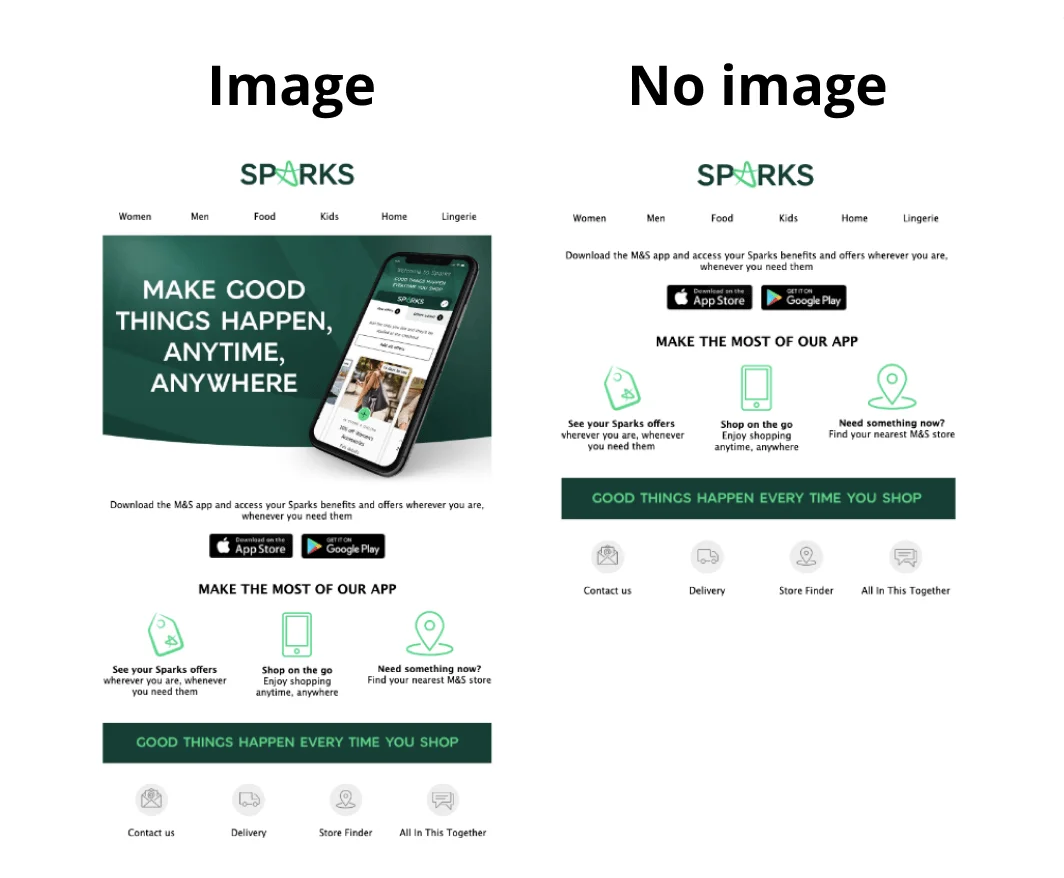
The simplest email design A/B test you can do is the image vs. no image test — take a look at this example from Sparks:
Calls-to-action
The end goal of a marketing email is to get subscribers to perform the target action. All the email elements play an important role in that persuasion — for example, content copies are meant to convince customers that performing the action will bring them something valuable.
But even if the rest of your email is perfect, a barely noticeable hyperlink or an unclear CTA copy can drastically decrease the CTR. That’s why CTAs are such an important test variable.
Here are popular CTA testing options:
- Button vs. text
- Button color, shape, size, and placement
- CTA copies
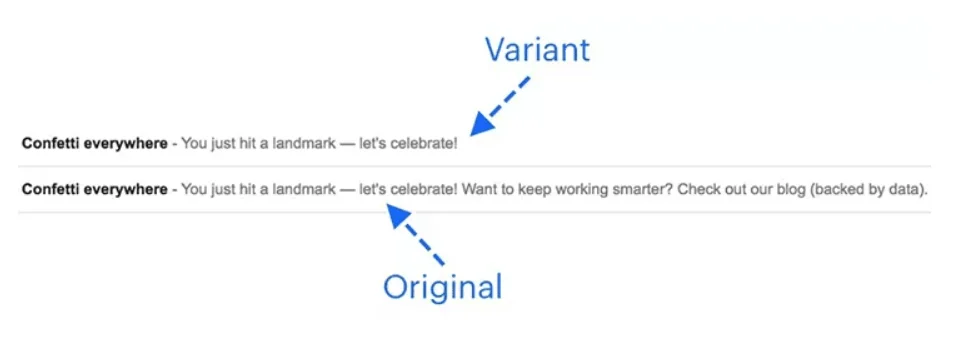
Here’s a great CTA copy test example:
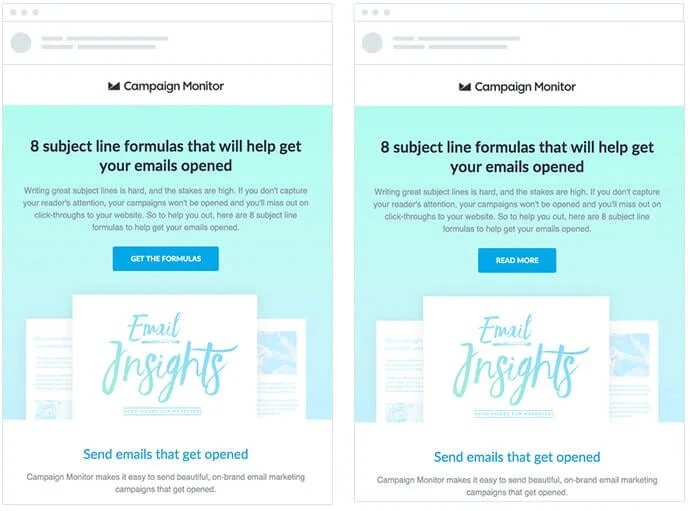
The version on the left is more specific and shows subscribers the exact profit they’ll get for clicking the button, while the version on the right is a basic CTA that doesn’t give a lot of information.
How to do A/B testing in email marketing
Now that you know which email parameters you can test, let’s take a closer look at the A/B testing process step-by-step.
Set up an objective
The worst thing you can do is start a research without understanding why you do it in the first place. At this stage, the main question you should answer is which metric you want to improve. There are three most popular email metrics for A/B testing:
- Open rate — how many people opened your email.
- Click-through rate, or CTR — how many people clicked the links in your email.
- Conversion rate — how many people performed the target action, i. e. signed up for a free trial or bought something using a discount code in your email.
But it’s more than that — your goal should be as specific as possible. For example, goals like “increase visibility” or “re-engage subscribers” are too vague to follow. To run a good A/B test that will improve your campaign’s efficiency, set a measurable objective like “increase the open rate by 15%”.
Pick the variable
Once you set up a goal, you need to formulate a hypothesis — an assumption that sounds like “Thing X affects metric Y”. The choice of the “X” variable depends on your objective. For example, if you want to improve the open rate, testing subject lines is more reasonable than testing content copies. Look at this spreadsheet if you’re in doubt.
| Email metric | Best email components to test |
| Open rate |
|
| CTR |
|
| Conversion rate |
|
But no matter which email component you choose, always test one variable at a time. Of course you can, for example, change two subject line features and get four variations like these:
| First name | Full name | |
| Emojis | 🎉 Alan, here’s your gift! | 🎉 Alan Smithee, here’s your gift! |
| No emojis | Alan, here’s your gift! | Alan Smithee, here’s your gift! |
However, if you run a test with these email subjects, you will only find the best combination of the two variables — for example, first name + emoji subject lines might generate the highest open rate compared to other email variations. But this research design doesn’t give you any data about the effects of each variable on its own.
What if you absolutely need to test several variables and find a perfect email subject recipe? The answer is: run these tests separately — it’s simpler and more insightful.
Set up the parameters
The next step defines the conditions for your A/B research, which include timing, sample, confounding variables, and success criteria. Let’s take a closer look at these parameters.
Timing. How long should you wait to get the test results? It depends on your campaign. If you test emails with a limited time offer that expires five hours after sending, stick to these five hours — especially if your metric of interest is conversion rates. But if it’s not your case, analyze your previous campaigns to see when you get the most clicks. For example, if most of your subscribers open the new email within the first 24 hours after you sent it, this is your time frame for the next A/B test.
Sample. To run the test, you need two subsets of subscribers, one for each email variation. Both subsets are modeling your population, which is the entire contact list. It means that these groups should be:
- Representative — for example, if one group only consists of men and the other consists of men and women, these samples are not representative. In this case, the difference in metrics can’t be fully explained by the email variation. To avoid this situation, keep the age and gender ratios in your test groups closer to the same ratios as in your full contact list.
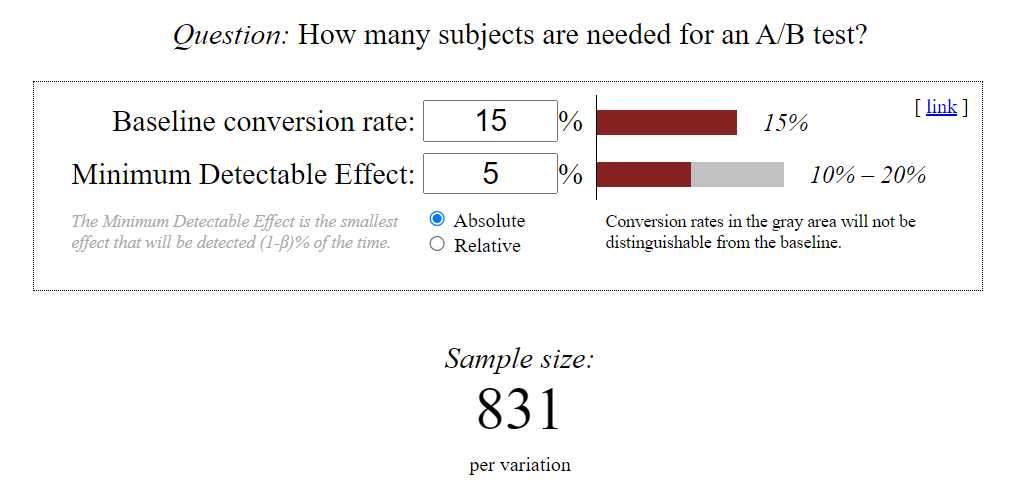
- Large enough for significance — you can’t assume a tendency after just two incidents. If you have less than 1000 subscribers, the best you can do is run a 50/50 test on the entire list. But if your readership is larger than that, calculate the sample size using online calculators — like this one. For example, if your average open rate is 15% and you consider an at least 5% increase significant, each of your groups should have 831 subscribers.
Confounding variables. It’s impossible to study the impact of one variable in a completely sterile environment. Confounding variables are external factors that might mess with your data and mislead you towards incorrect conclusions. Some of these factors are in your control — like your sample. You can decrease the influence of age, gender, location, and other characteristics of participants if you carefully select subscribers for the research. Other factors are beyond your control — like the novelty factor. For example, if you’ve never used emojis in subject lines before, emails with emojis might get more clicks just because it’s a fun new thing for subscribers. In such cases, you can run another A/B test with the same design to validate the data.
Success criteria. The 5% effect we’ve mentioned earlier is the minimal value that is statistically significant and indicates that the variable somewhat affects the metric. But how do you know the test was successful and the idea you were testing actually works? To not get lost, you need to set a measurable and realistic goal — for example, a 20% higher open rate.
Run the test
There are two ways to run the test — automated and manual. Many ESPs have an A/B testing feature. If you’re using Selzy, read our guide on how to run automated tests.
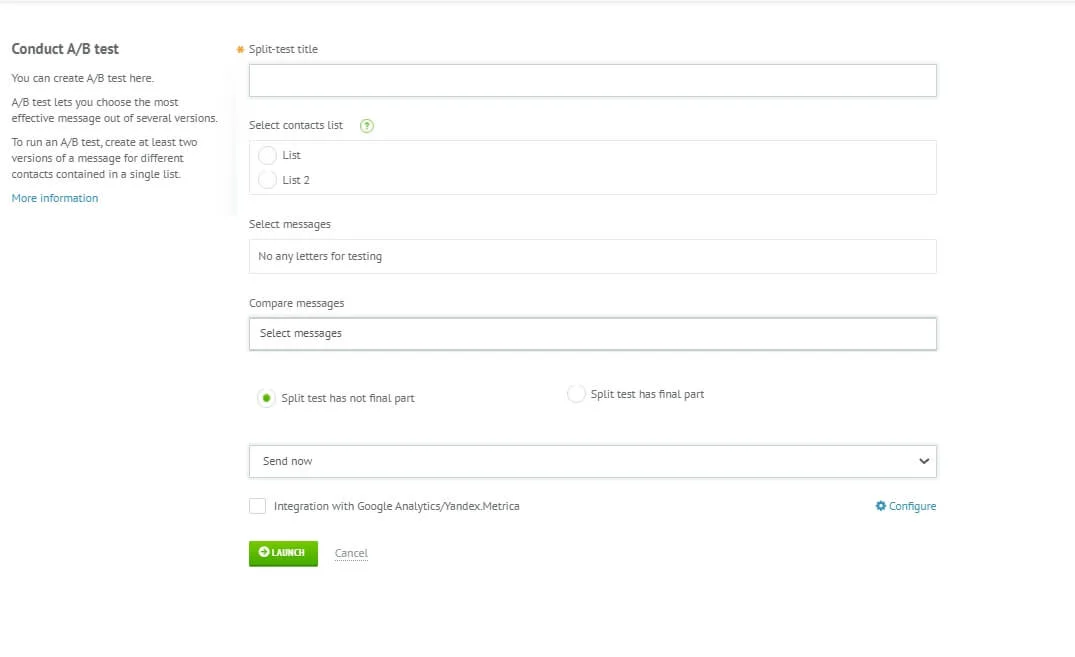
The manual method is creating two separate campaigns by hand in your ESP of choice without using the A/B testing feature. Although it’s more time-consuming, manual testing gives you better data on the subscribers’ behavior outside the email itself — like purchases or website metrics. But if you’re just studying open rates, manual testing is excessive. In this case, we suggest sticking to the automated method.
Analyze the results and optimize
Once your timeframe is done, take a look at the stats, compare the metrics, and choose your winner. If you’re running an automated test in Selzy, this is where you look for the information:
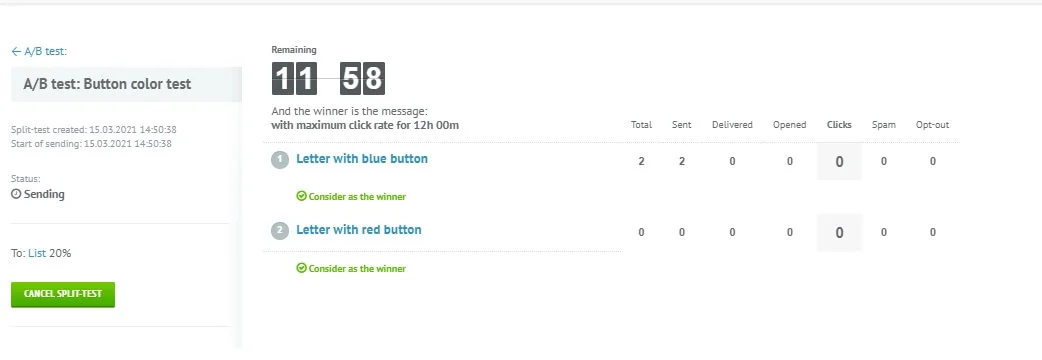
However, here comes the sad part. The problem is, ESPs don’t take statistical significance into account. This variable doesn’t show how big the metric difference is but how likely it is to occur again — and whether the difference has occurred because of the variable you tested. For example, even if you saw a 50% increase in open rates, it doesn’t mean you’ll see it again — and this increase might have nothing to do with emojis in a subject line. That’s why you can’t jump to definitive conclusions right away and blindly trust the numbers.
The solution is to use A/B test calculators or data analysis software like SPSS — both will help you find how significant your test results are. Another way to verify the data is to run several A/B tests in a row and see if the pattern is the same across all your experiments.
Does it mean that A/B testing is misleading? No, the numbers are still reliable. However, we suggest taking them with a grain of salt before assuming trends.
Wrapping up
A/B testing is the process of sending two versions of the same email to two groups of subscribers that helps marketers find out which email content ideas are more effective than others. It’s a great practice that helps you boost the campaigns’ ROI, spend the marketing budget wisely, and get valuable insights about the target audience.
Here’s how to conduct an A/B test research:
- Set up an objective — understand why you’re running a test and which metric you want to improve.
- Pick the variable — decide which email component will be different in two versions.
- Set up the parameters — define the success criteria for your test and confounding factors, calculate the necessary sample size, and set up the time frame for collecting data.
- Run the test — start two separate email campaigns manually or use automated A/B testing in your email marketing software of choice.
- Analyze the results and optimize — choose the winner, repeat the test to verify your data and use the results for future campaigns and further research to make the most of your emails.
