



Key takeaways
- Email unsubscribe rate is a feedback signal, not a complete measure of list health
- Calculate unsubscribe rate using unique unsubscribes ÷ delivered emails × 100
- Unsubscribe rate benchmarks vary based on industry, list source, audience, and more
- Interpret unsubscribe-rate changes based on signals like one-off spikes, gradual increases, high rates among new subscribers, and more
- People unsubscribe due to expectation mismatch, irrelevant content, excessive frequency, poor acquisition quality, and more
Email unsubscribe rate is the percentage of delivered campaign recipients who opt out after a send. Calculate it consistently, then interpret it against your own baseline, similar campaigns, audience cohorts, and relevant industry context. One send rarely tells the whole story: the trend and the signals around it matter more than a universal good-or-bad cutoff.
What is an email unsubscribe rate?
Email unsubscribe rate measures explicit opt-outs associated with a campaign. It helps marketers see whether recipients still want the type, value, and frequency of messages they receive.
It is a feedback signal, not a complete measure of list health. The rate does not include people who silently disengage, mark a message as spam, use an inbox-level block, or keep receiving without clicking. Review it together with complaints, bounces, clicks or conversions, active-audience size, and net list growth.
Campaign unsubscribe rate is also different from list churn over a month or quarter. Campaign rate evaluates a send; churn considers all contacts lost over time. Make the unsubscribe link easy to find rather than hiding dissatisfaction behind friction.
How to calculate the unsubscribe rate
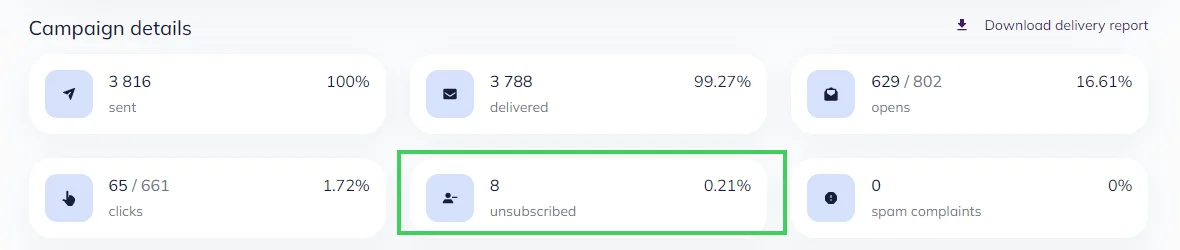
Most email service providers calculate this metric automatically. For a campaign-level view, use:
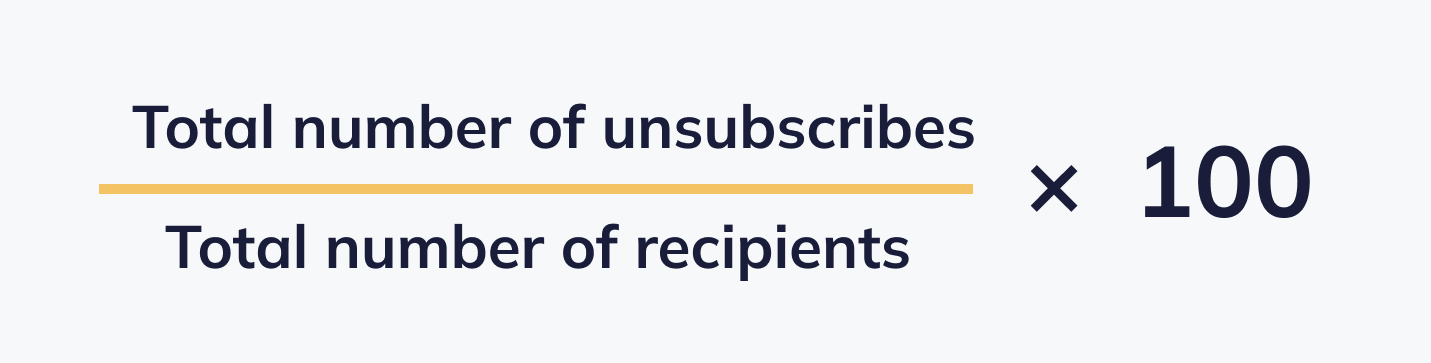
Unsubscribe rate = unique unsubscribes ÷ delivered emails × 100
If three people unsubscribe after 1,000 emails are delivered, the unsubscribe rate is 3 ÷ 1,000 × 100 = 0.3%. Record the result, but do not label it good or bad without context.
Check your platform’s denominator before comparing reports. Some systems use delivered emails, while others may show a rate based on sent messages or unique recipients. A calculation that includes bounces produces a different result. Use one definition consistently for your internal trend and note methodological differences when using external benchmarks.
Also confirm whether the numerator counts unique recipients or unsubscribe events. One person should not inflate the campaign metric because several preference records changed.
Unsubscribe rate benchmarks
There is no universal unsubscribe rate that is healthy for every sender. Industry, list source, audience age, lifecycle stage, campaign type, cadence, geography, season, and provider methodology all affect the number.
Use Selzy’s current email marketing benchmarks by industry as context for comparable campaigns, not as a pass/fail threshold. If you consult the GetResponse benchmark report or another provider, check the reporting period, sample, campaign definition, and denominator before comparing it with Selzy data.
How to use benchmarks: compare like with like, use external data to understand the range, and manage your program against its own median and trend. A rate below an industry average can still be concerning if it doubled after an acquisition or frequency change.
How to interpret unsubscribe-rate changes
A single spike can come from a strong campaign opinion, an old segment, a holiday send, or a recent frequency change. A sustained increase across several similar campaigns is more likely to point to an expectation, targeting, content, or list-quality problem.
| Signal | What it may mean | What to check |
| One-off spike | Campaign-specific mismatch or unusual audience | Offer, subject, segment, and recent send history |
| Gradual increase | Fatigue, declining relevance, or list aging | Cadence, content mix, engagement, and cohort age |
| High rate among new subscribers | Signup promise or acquisition-quality mismatch | Form copy, incentive, source, and welcome sequence |
| High rate from one source | Low-intent or poorly described acquisition channel | Consent context, source expectations, and targeting |
| Spike after frequency change | New cadence exceeded expectations | Previous cadence, preferences, and send concentration |
| Stable opt-outs but rising complaints | Unsubscribe friction or stronger dissatisfaction | Link visibility, complaint trend, and audience eligibility |
Lower unsubscribe rate is not automatically an improvement. If complaints rise after the opt-out link becomes harder to find, the list is not healthier. Conversely, a temporary increase after making preferences clearer can remove disengaged contacts and improve future relevance.
Why people unsubscribe from emails
People unsubscribe when the inbox experience no longer matches the value or expectations established at signup. Common causes include:
- Expectation mismatch. The form promised one topic or cadence, while the emails deliver another.
- Irrelevant content. One broad campaign reaches people with different needs, roles, or lifecycle stages.
- Excessive or unpredictable frequency. Sends cluster unexpectedly or become more frequent without warning.
- Poor acquisition quality. Incentive-only, low-intent, outdated, or unclear sources create fragile lists.
- Repetitive or low-value content. Every message asks for a purchase without teaching, helping, or rewarding attention.
- Weak experience. Inaccessible layouts, broken links, slow images, or poor mobile rendering make emails difficult to use.
- Changed needs. A recipient may no longer need the product or topic, even when the program is well run.
- Trust concerns. Unexpected personalization, unclear data use, or unfamiliar sending identity can make messages feel unsafe.
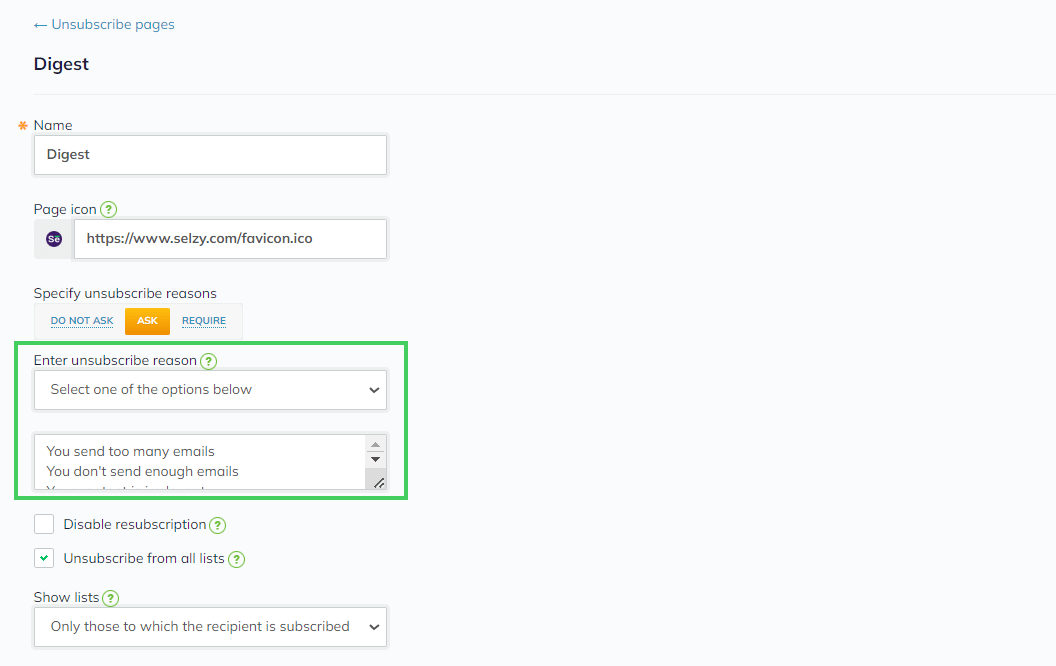
Ask for optional feedback on the unsubscribe page without blocking the opt-out. In Selzy, you can edit the unsubscribe-reasons survey in Campaign defaults. Use the answers as directional evidence rather than assuming every person will complete the poll.
How to diagnose a high unsubscribe rate
- Confirm the calculation. Check delivered volume, unique unsubscribes, reporting window, and platform definition.
- Compare similar sends. Use the previous 5–10 campaigns with a similar audience, purpose, and cadence.
- Segment the result. Review signup source, cohort age, lifecycle stage, geography, device, campaign type, and frequency.
- Check adjacent signals. Look for changes in complaints, bounces, clicks, conversions, active audience, and list growth.
- Review the promise-to-content match. Compare signup language, subject line, preheader, body, and CTA.
- Read qualitative feedback. Use unsubscribe reasons, replies, support conversations, and survey responses.
- Form a narrow hypothesis. Identify the likely cause before changing the entire program.
Track cohort behavior over time. A list can show a stable overall rate while a new acquisition source performs poorly and an established cohort performs well. Aggregates hide problems that segmentation reveals.
How to lower your email unsubscribe rates
Set accurate expectations at signup
Tell people what they will receive, how often, and from whom. Keep the form, confirmation, welcome sequence, and regular campaigns consistent. Do not use a broad incentive to collect contacts for unrelated content.
Improve acquisition quality
Measure performance by source, not only total growth. Pause sources that produce rapid disengagement, complaints, or low-value contacts. Clear permission and a relevant value proposition produce a smaller but more durable audience.
Segment by need and lifecycle
Use behavior, preferences, lifecycle stage, and customer context to avoid sending every message to everyone. Selzy’s list segmentation tools and these email segmentation ideas can help.
Use meaningful personalization
A first name is not a relevance strategy. Personalize topic, offer, timing, examples, and next action from data the recipient reasonably expects you to use. Test fallback content so missing fields never create an awkward message.
Use personalization carefully; surprising or overly intimate details can increase distrust instead of relevance.
Deliver consistent value
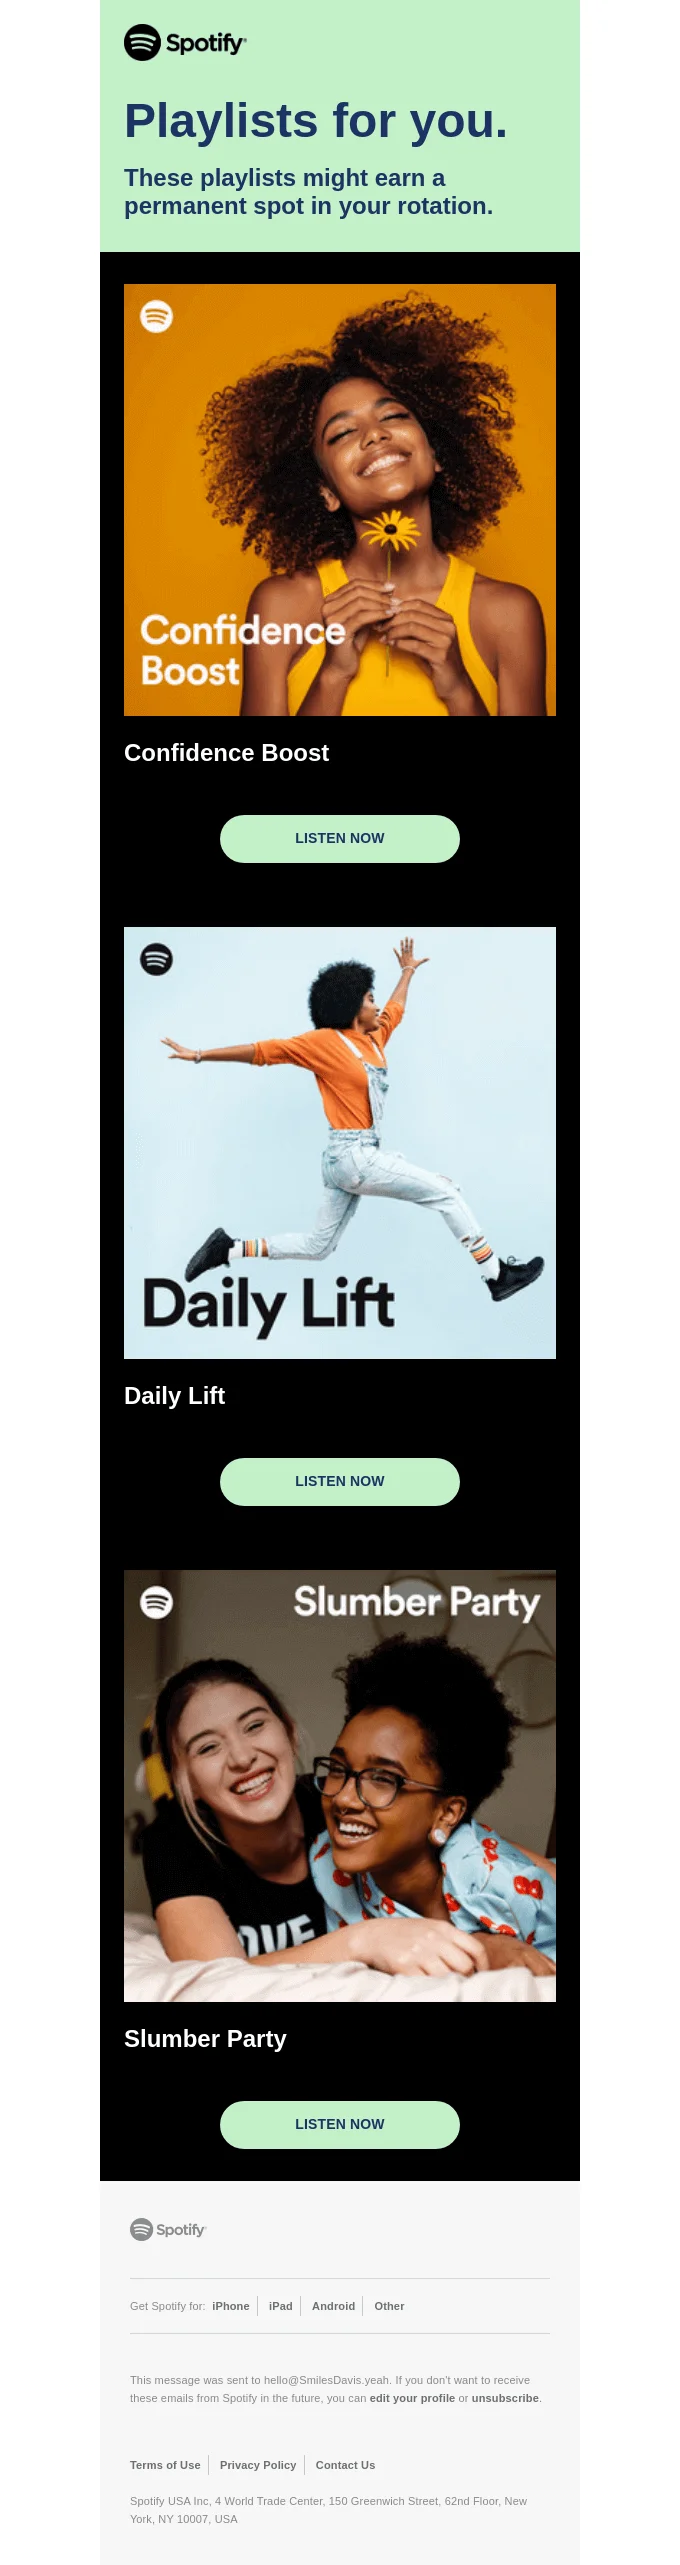
Balance promotions with education, useful updates, resources, stories, or service. The right mix depends on why people subscribed. Evaluate clicks and downstream actions by content type instead of assuming every send needs immediate revenue.
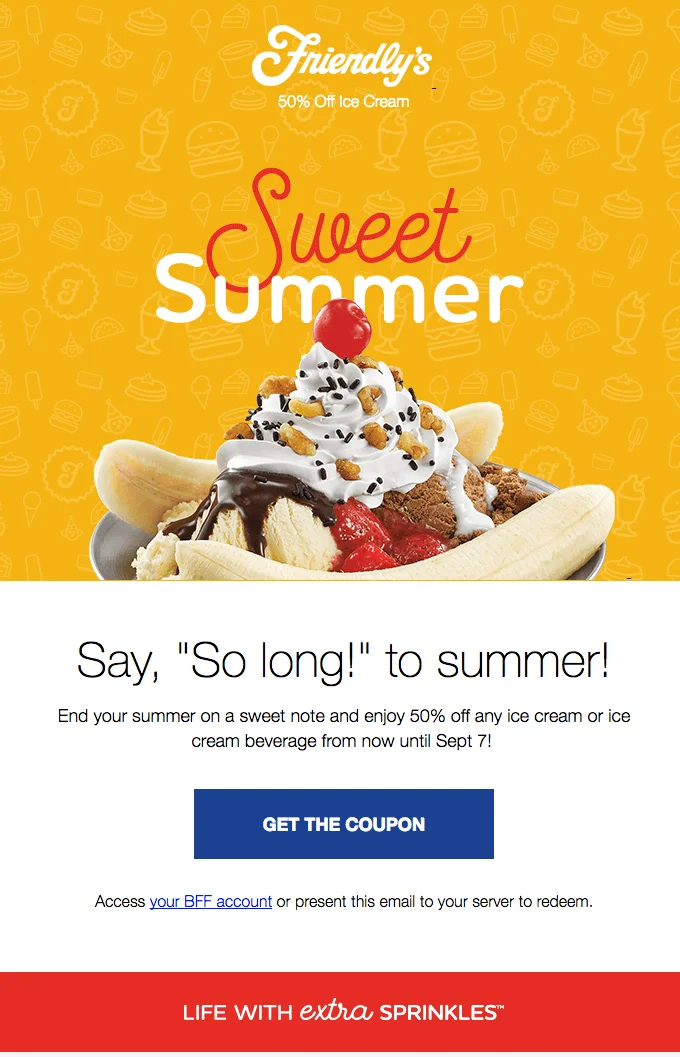
Offer frequency and topic preferences
Some people want fewer messages rather than no messages. A preference center can offer weekly digest, product updates only, promotions only, a temporary pause, or channel choices. Preserve a clear full-unsubscribe option and do not turn preference selection into mandatory friction.
Keep a predictable schedule
Plan campaigns so sends do not cluster accidentally. An email marketing calendar helps teams coordinate launches, seasonal messages, and lifecycle automations. If frequency changes, explain the new expectation or let subscribers choose.
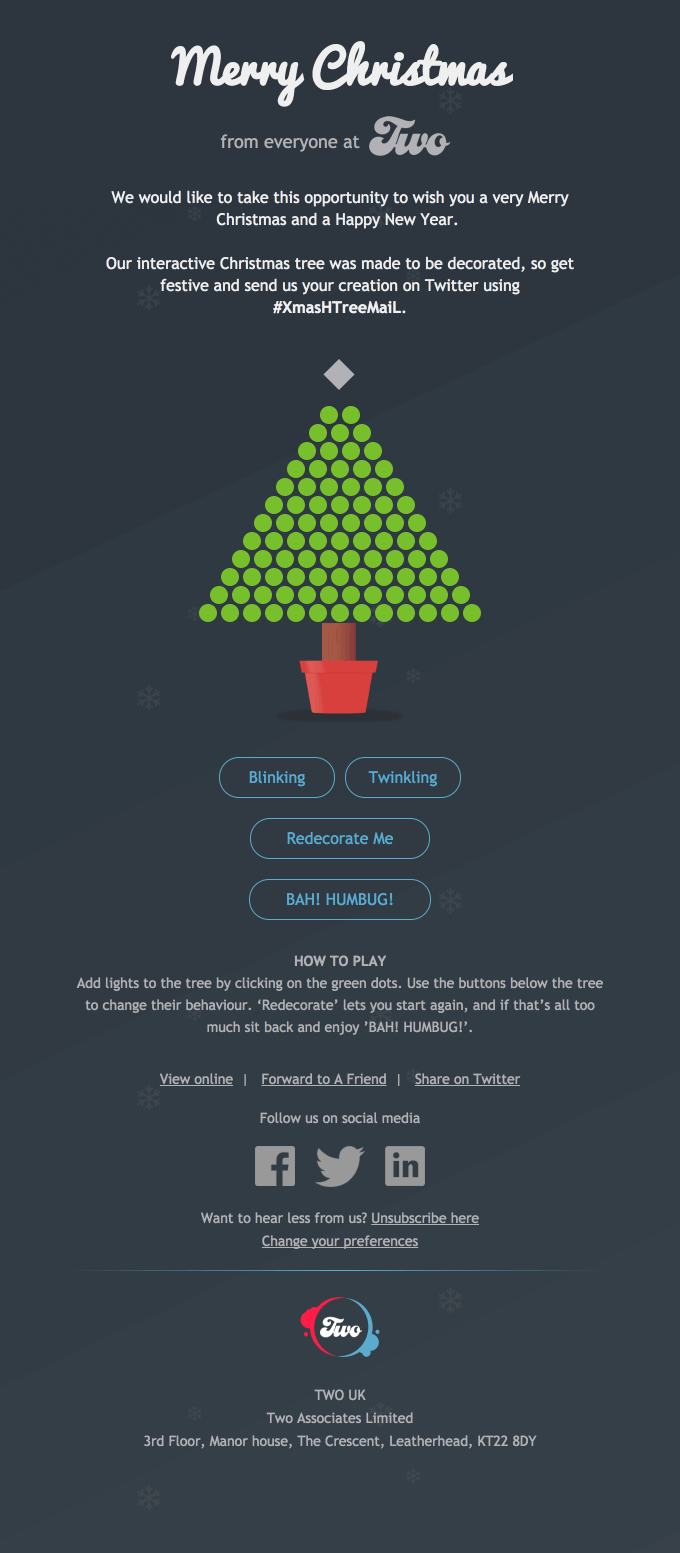
Design for accessibility and mobile use
Use readable type, useful alt text, clear hierarchy, descriptive links, and tap-friendly controls. Selzy’s guide to email accessibility provides a practical checklist. Avoid spam-like patterns and review these email spam words in context rather than treating individual words as automatic filters.
Make unsubscribing easy
A visible, functioning opt-out protects recipient control and gives dissatisfied people a better alternative to a spam complaint. Use Selzy’s options to edit the unsubscribe page, but keep the main action clear.
Use re-engagement and a sunset policy
Define inactivity according to your cadence and customer cycle. Reduce frequency or send a focused re-engagement sequence, then suppress contacts who remain inactive according to your policy. Keep opted-out contacts on suppression so they are not accidentally re-added; suppression is different from deleting every historical record.
Test one meaningful variable at a time
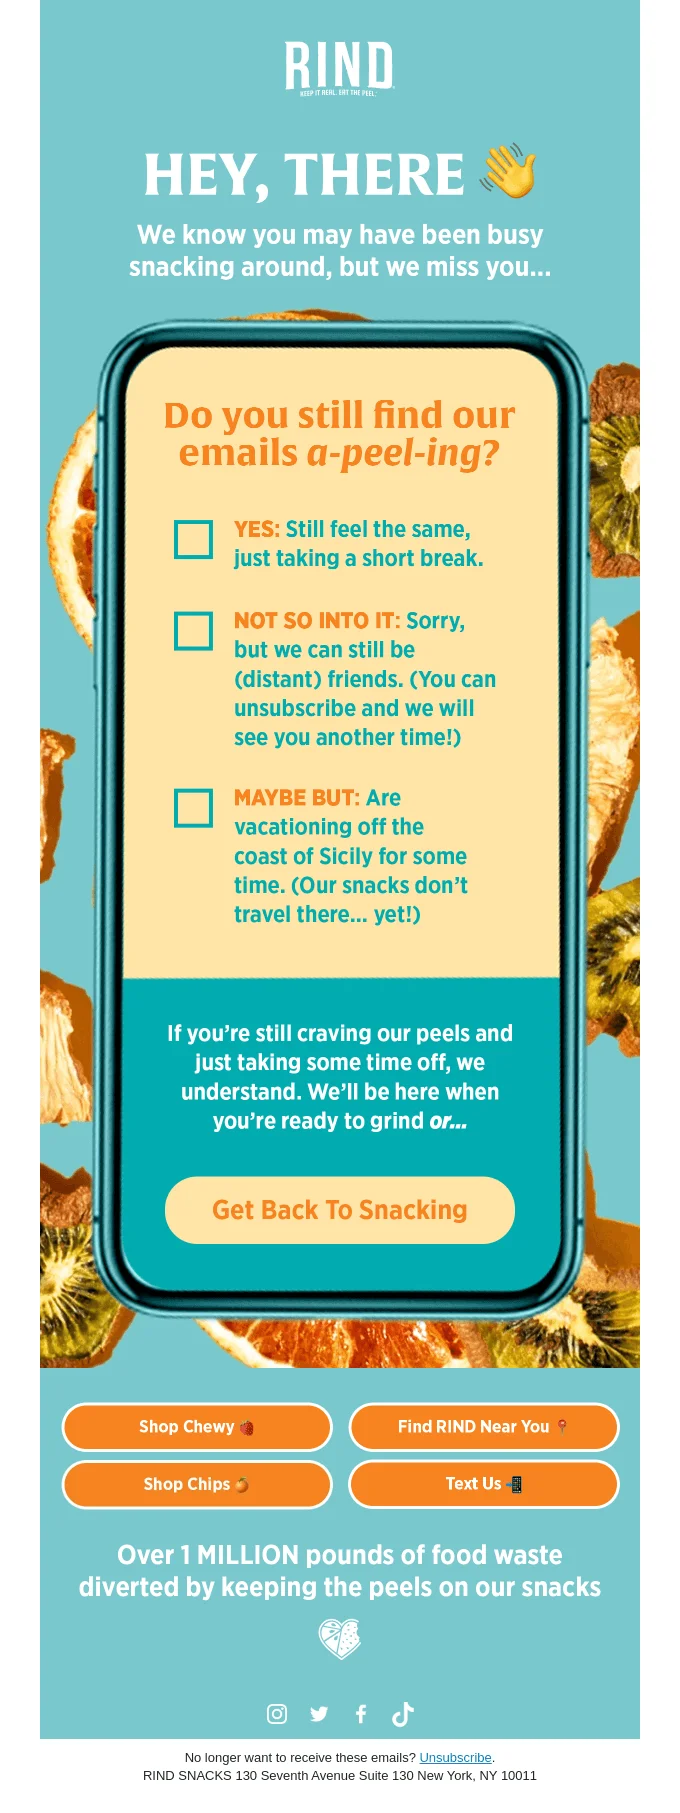
Test audience, frequency, content promise, format, or preference options while keeping enough of the campaign stable to interpret the result. Pair quantitative results with direct feedback. A short embedded survey can reduce friction; see Selzy’s guide to embedding surveys in email and these interactive email examples.
Test the complete subscriber experience
Review the message on a narrow screen from the sender identity and preheader through the footer, preference link, and unsubscribe link. A campaign can look polished on desktop and still frustrate recipients if columns collapse badly, text becomes tiny, or controls are difficult to tap. Accessibility improvements often make the experience clearer for every reader, not only people using assistive technology.
Test the full opt-out journey regularly. Confirm that the link opens, the selected address is recognized, confirmation language is unambiguous, and suppression reaches every relevant sending workflow. If recipients can choose topics or frequency, present those controls as optional alternatives rather than obstacles. Document how imports, integrations, and manual list work preserve suppression status.
Adapt inactivity rules to the relationship
A daily publisher, a monthly newsletter, and a business with an annual renewal cycle should not use the same inactivity definition. Before suppressing contacts, check whether tracking limitations or long purchase cycles could make active customers appear inactive. Write down the rule, apply it consistently, and review it whenever cadence, acquisition, or customer behavior changes.
A re-engagement campaign should remind people why they subscribed, offer a clear reason to remain, and make the next choice easy. Avoid extending the sequence indefinitely simply to retain list size. If recipients do not respond within the defined window, suppression can protect engagement quality and reduce the chance that an unwanted message becomes a complaint.
Design tests around decisions
Define the decision before a test begins: the audience, observation window, primary metric, guardrail metrics, and the change you will make after each plausible result. Unsubscribe rate may be a guardrail rather than the main success metric. A campaign can generate more conversions while also producing an unacceptable rise in complaints or opt-outs within a specific cohort.
Change one meaningful dimension at a time when possible. Testing a new segment, offer, cadence, subject line, template, and sender simultaneously may produce a result, but it will not explain the cause. Keep a short experiment log so the team can connect later changes with the assumptions, audience, and outcome of each test.
Monitor cohorts, not only totals
Create a recurring view by signup source, subscription age, lifecycle stage, campaign type, and frequency group. Compare each cohort with its own history. This helps distinguish a broad content problem from a localized acquisition or automation issue. Review both rate and count: a dramatic percentage based on a tiny group deserves investigation, but should not outweigh a stable pattern across a large audience.
Keep notes about launches, promotions, list imports, cadence changes, template changes, and tracking changes beside the data. Without that context, a team may attribute movement to copy when the real cause was audience composition. A concise campaign log turns unsubscribe reporting from a retrospective score into a diagnostic tool.
Coordinate ownership across the team
Reducing unwanted opt-outs is not only a copywriting task. Acquisition owners define the signup promise, lifecycle marketers manage cadence and automation, designers shape usability, analysts maintain definitions, and support teams hear direct feedback. Agree on who investigates a spike, who can pause a source or workflow, and which signals require escalation.
Use a review rhythm that matches sending volume. A high-volume program may need weekly monitoring, while a monthly newsletter can review after each send. The goal is not to prevent every unsubscribe. It is to reach people who knowingly subscribed, deliver the value they expected, and give them respectful control over the relationship.
When a rate changes, avoid reacting with a blanket reduction in sending. First identify which audience, source, or campaign type moved and whether complaints, engagement, and conversions changed with it. The appropriate response may be clearer acquisition copy, a repaired automation, a preference option, a cadence adjustment, or more relevant content. Evidence from the affected cohort should determine the intervention. Record the hypothesis and the expected outcome so the next review can distinguish a real improvement from ordinary campaign variation.
Finally, evaluate the result over several comparable sends. List composition naturally changes as people join, buy, become inactive, or leave, so one campaign cannot prove a durable improvement. Preserve recipient choice throughout the process: an honest unsubscribe is useful information, while hiding the link only masks dissatisfaction and can shift it into complaints or disengagement.

Final thoughts
Unsubscribe rate is useful feedback, not a standalone verdict. Calculate it consistently, compare it with your own baseline and relevant benchmarks, and diagnose changes by cohort, source, content, and frequency.
Make preferences and opt-out easy, then improve acquisition, relevance, value, cadence, and list hygiene. A smaller engaged list is healthier than a larger list held through friction.
FAQ
What is an email unsubscribe rate?
Email unsubscribe rate is the percentage of delivered campaign recipients who opt out after a send. It measures explicit opt-outs, so it is a feedback signal about whether people still want your type, value, and frequency of messages. It does not capture silent disengagement, spam complaints, inbox blocks, or other forms of list decline.
How do you calculate unsubscribe rate?
Use this formula: unsubscribe rate = unique unsubscribes ÷ delivered emails × 100. For example, if 3 people unsubscribe after 1,000 delivered emails, the rate is 0.3%. Make sure you know whether your platform uses delivered emails, sent messages, or unique recipients as the denominator, and keep that definition consistent.
What is a good unsubscribe rate?
There is no universal good or bad unsubscribe rate. The right context is your own baseline, similar campaigns, audience cohorts, and relevant industry benchmarks. A rate below an industry average can still be a concern if it rises sharply after an acquisition or frequency change.
Why did my unsubscribe rate suddenly increase?
A one-off spike can come from a campaign-specific mismatch, an old segment, a holiday send, or a recent frequency change. If the increase continues across several similar campaigns, it more likely points to an issue with expectations, targeting, content, or list quality. Compare the send with your recent trend and audience context before drawing conclusions.
How can I reduce unsubscribes without making the unsubscribe process harder?
Make the unsubscribe link easy to find rather than hiding dissatisfaction behind friction. Then use the rate as a signal to review message relevance, cadence, targeting, and list quality. Track it alongside complaints, bounces, clicks or conversions, active-audience size, and net list growth so you can improve the program without forcing unwanted subscriptions to linger.
 New and noteworthy on our blog