


What is data-driven email marketing?
Data-driven email marketing is the approach of using data to inform and improve your email strategy. It is a continuous cycle of collecting data, analyzing it, applying it to your email strategy, testing, and measuring the results. Then, you repeat the cycle and make adjustments based on the feedback and insights you get.
Data can help answer questions like:
- Who are your subscribers and what are their characteristics?
- What are their interests, preferences, and pain points?
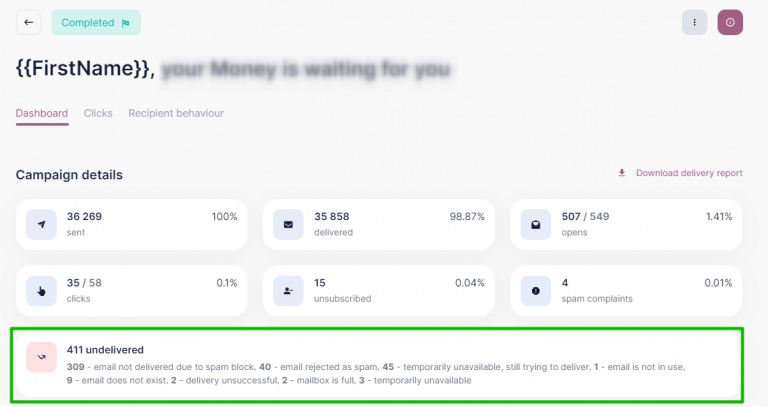
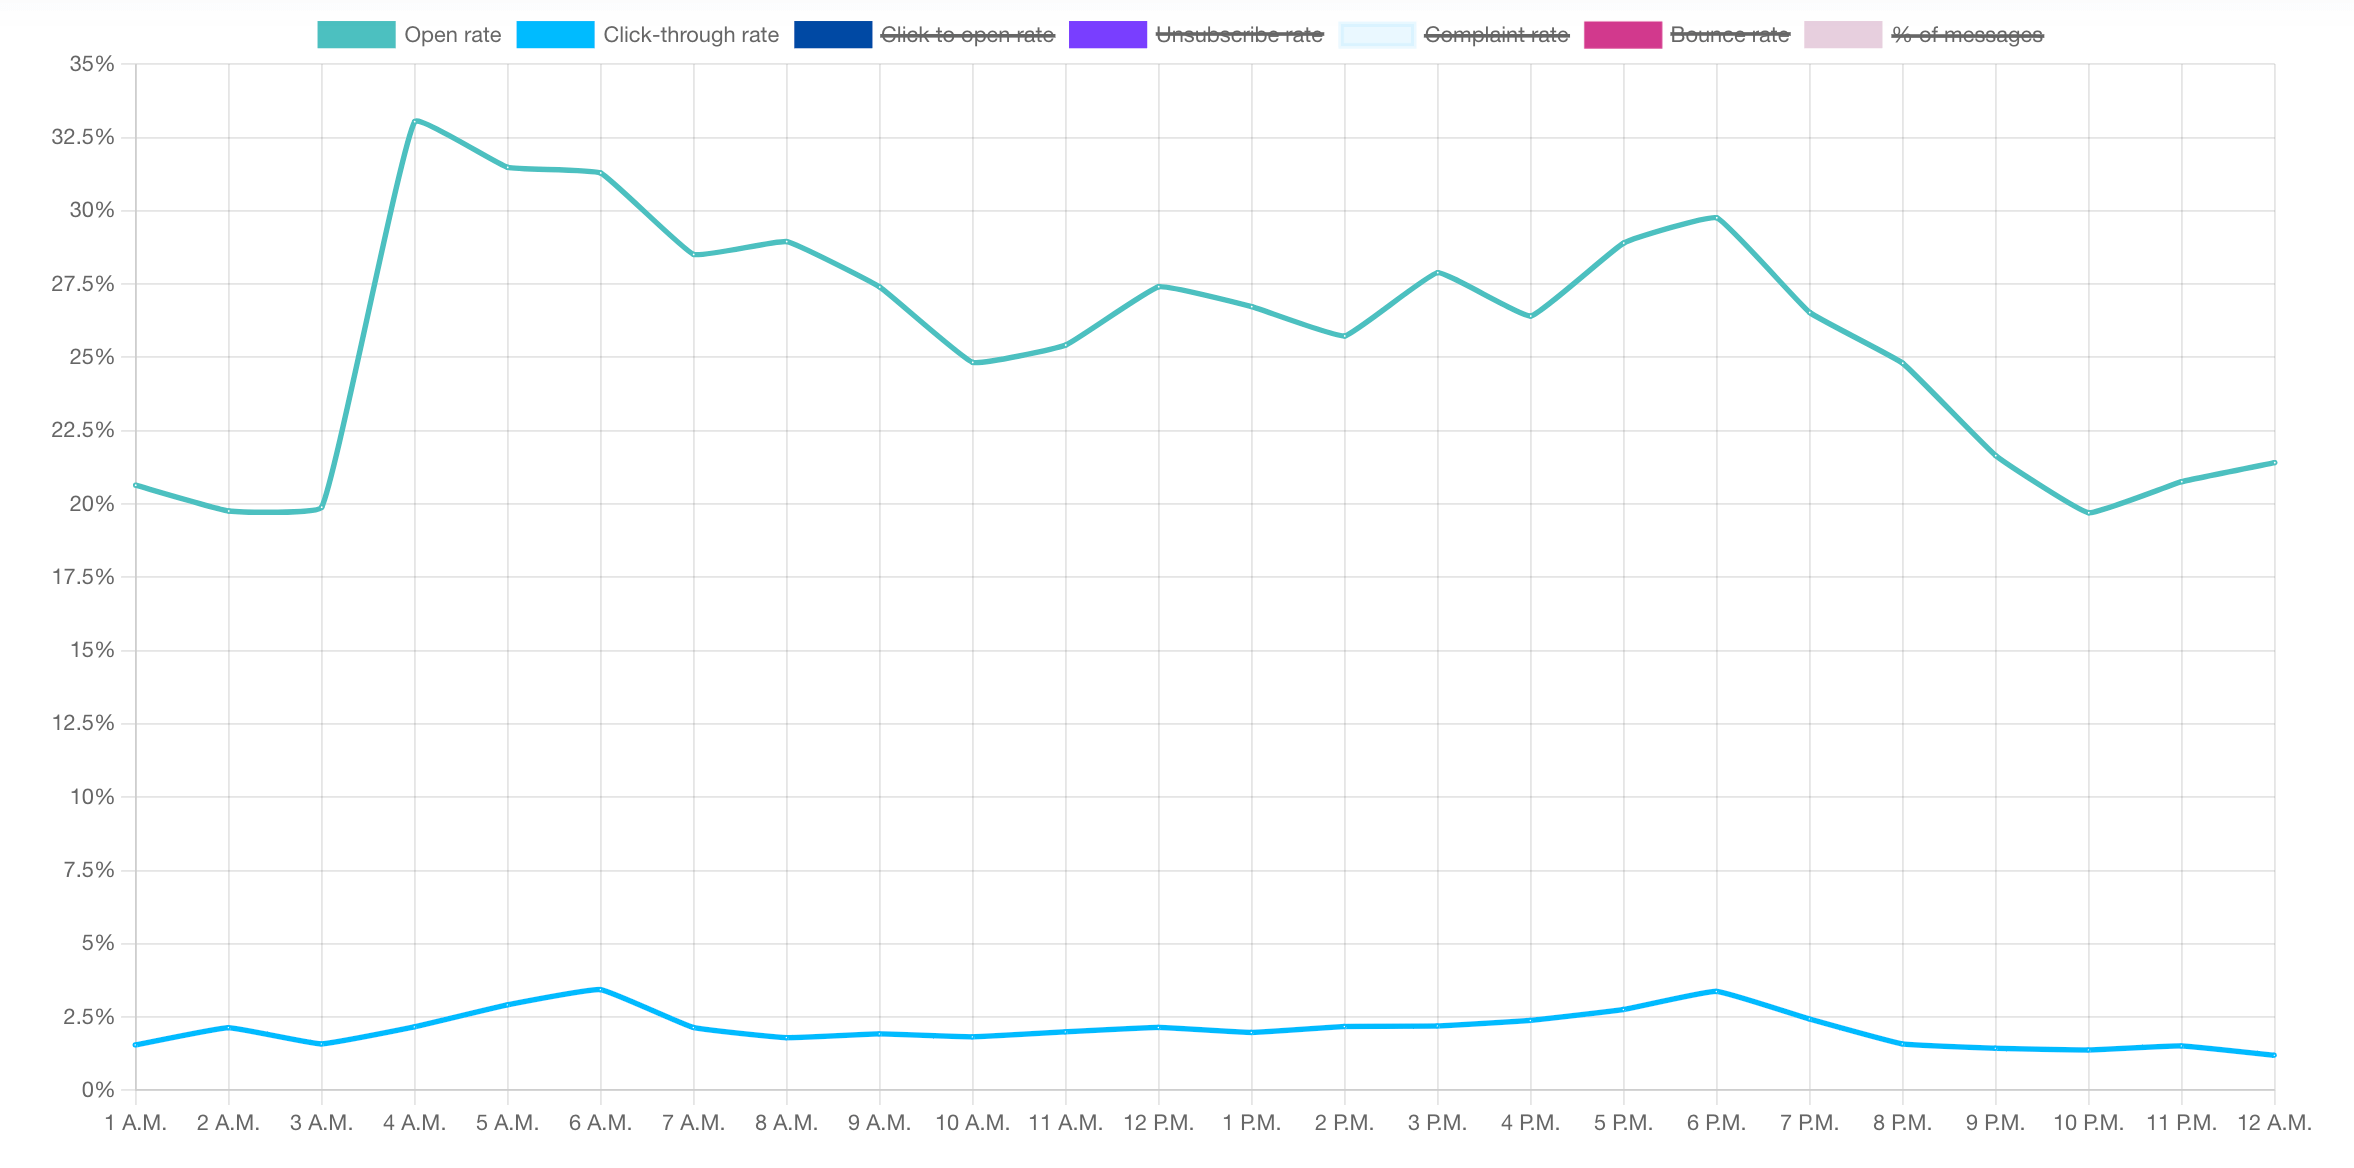
- How do they interact with your emails and website?
- What are their goals and challenges?
- How do they move along the customer journey?
- What are the best ways to reach them and engage them?
By using data to answer these questions, your business can create more relevant, personalized, and effective email campaigns that resonate with your audience and drive conversions.