


Most marketers are familiar with the most important email marketing KPIs: open and click-through rates, but these don’t paint the whole picture. There are other metrics you need to follow closely to ensure the effectiveness of your email marketing campaign.
But which key performance indicators (KPIs) are worth knowing in depth? In this article, we’ve listed ten metrics that can help you manage your strategic objectives, analyze campaign performance, and bring success closer.
Important KPIs for email marketing
When each email campaign has a different objective, it’s good to set main KPIs to track over different time periods and even choose specific KPIs for each email type.
Let’s glance over all the important metrics and when and why they should matter to you. For “per campaign” metrics, check them after each email campaign, and for the “overall” ones, make sure to take a look at them weekly, monthly, or quarterly, according to your planning schedule.
| Email marketing KPI | Type (per campaign or overall) | Why prioritize |
| Open rate | Per campaign | For awareness-focused campaigns and whenever you need to improve upon subject lines and timing |
| Delivery rate | Per campaign or overall | For health monitoring, especially important when you’re starting out |
| Bounce rate | Per campaign or overall | For health monitoring and to maintain deliverability |
| CTR | Per campaign | For engagement-focused campaigns |
| Conversion rate | Per campaign or overall | For sales or lead generation-focused campaigns |
| ROI | Per campaign or overall | For email marketing audits and to make sure the channel is profitable |
| Unsubscribe rate | Per campaign | For health monitoring, detecting content fatigue and possible audience mismatch |
| List growth rate | Overall | For long-term list-building and lead generation-focused campaigns |
| Email sharing (forwarding) rate | Per campaign | For referral and brand awareness-focused campaigns |
| Revenue | Per campaign or overall | For sales-focused campaigns |
Now that you get the general idea, let’s dive deep into the most important KPIs for email marketing and why each one matters. By the way, your provider’s email marketing dashboard likely includes everything you need to track!
Delivery rate
Delivery rate is the percentage of emails delivered to your subscribers’ inboxes.
The formula to calculate it is: (Emails sent – (Bounced + Marked as spam)) / Emails sent x 100.
Delivery rate is an important metric, especially in the first waves of your campaign. If your list is built correctly (e.g., you didn’t buy a list), you can expect a delivery rate of over 99% (less than 1% bounce).
A poor delivery rate indicates a low-quality subscriber list or a low-quality email service provider. In the former case, consider pruning or starting from scratch, and in the latter, consider switching services.
Here’s an example of how Selzy’s campaign performed:
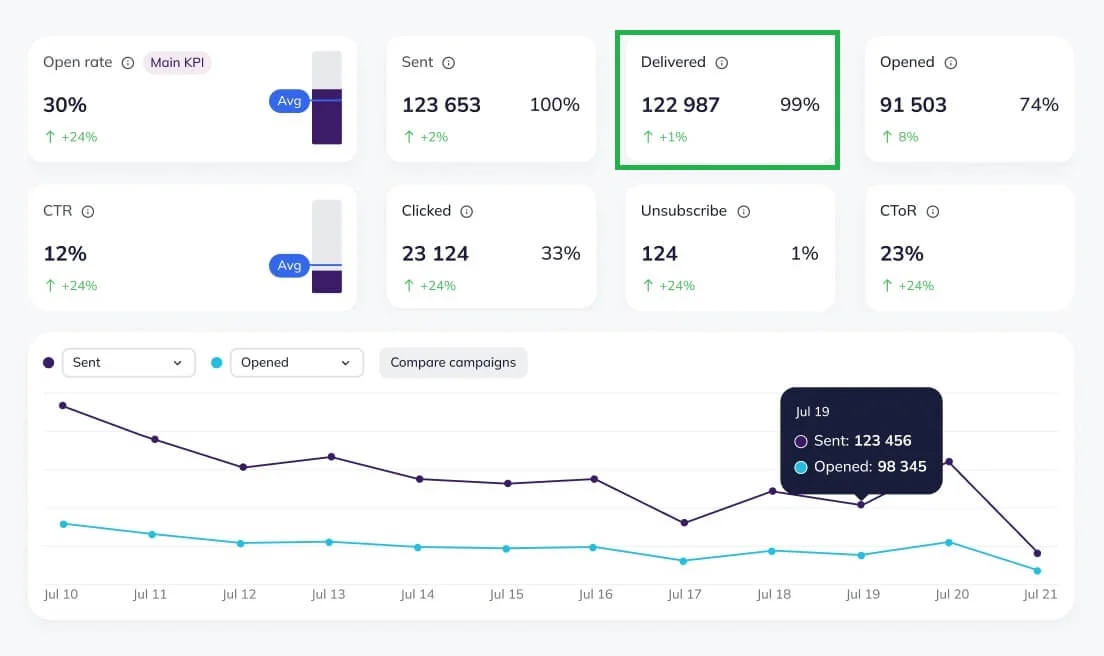
All the effort to create a perfect campaign will go to waste if your email doesn’t get to your subscribers’ inboxes. Need more information? Read out guide on email deliverability.
Bounce rate
Bounce rate is the number of emails that get rejected by the server.
The formula to calculate it is: Number of undelivered emails / Number of emails sent x 100.
Bounces can occur if, for example:
- The email is invalid (nonexistent).
- There is a virus or a problematic file attached.
- Your email is flagged as spam due to problematic words.
- Sender IP or domain is blacklisted.
What is the average bounce rate? Across industries, the average bounce rate is 2.79%.
Bounces can be soft (a campaign was rejected by the inbox provider due to temporary issues) and hard (a campaign couldn’t get delivered because of various reasons). Both of these can be calculated separately, and a good email marketing platform will give you a breakdown of the types of bounces you get.

Open rate
Open rate is the percentage of people who opened and read your email.
The formula to calculate the total open rate is: Number of total opened emails / Number of delivered emails x 100.
The formula to calculate the unique open rate is: Number of unique opens / Number of delivered emails x 100.
There are two types of open rates: unique and total. The first counts the number of people who opened that email, while “total” counts each time the email is opened. For example, if the same subscriber opens the same email ten times, that’s ten total open counts, while just one unique open.
Take a look at the screenshot below. The total open rate there is 91,503 ÷ 122,987 = 0.74 (or 74%). Note that the total open rate can go over 100%.
Unique open rate is a more relevant metric, shown highlighted below as 30%. Unique open rate max is 100%.
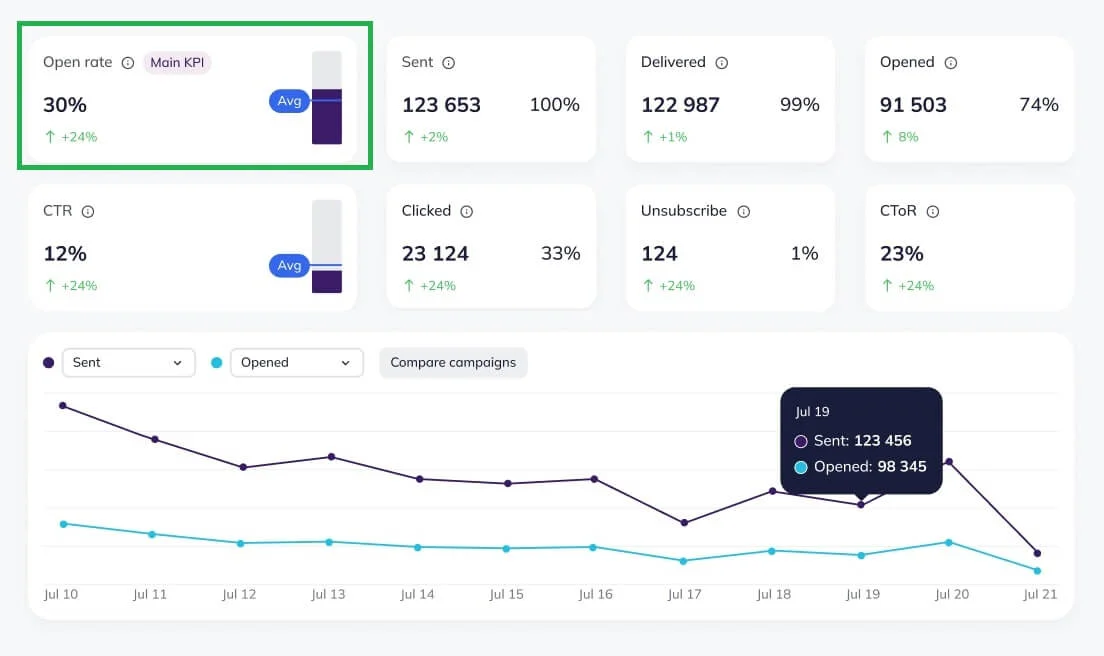
Due to privacy settings in some email providers (like Apple Mail), not every open is counted.
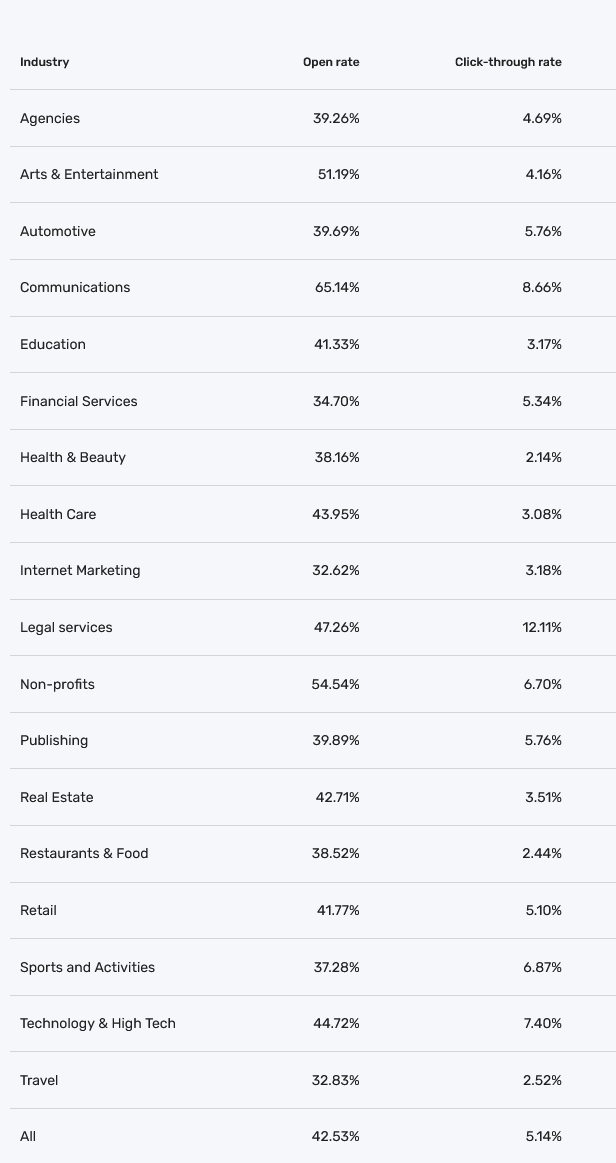
What is the average open rate? The average open rate in 2024 was 30%, according to Selzy. Anything beyond that can be considered a good result.
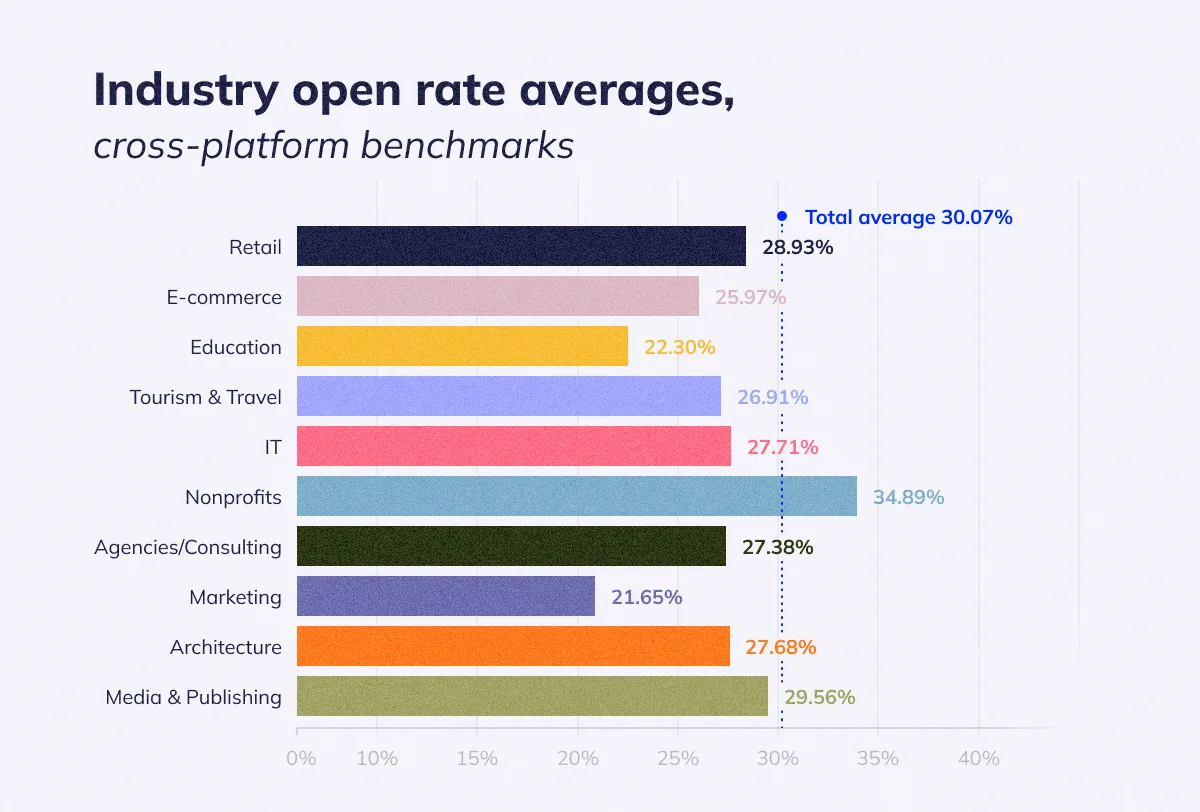
But the open rate also depends on the type of email and industry. For example, nonprofits have higher open rates of 35% while marketing gets 22%.
Click-through rate (CTR)
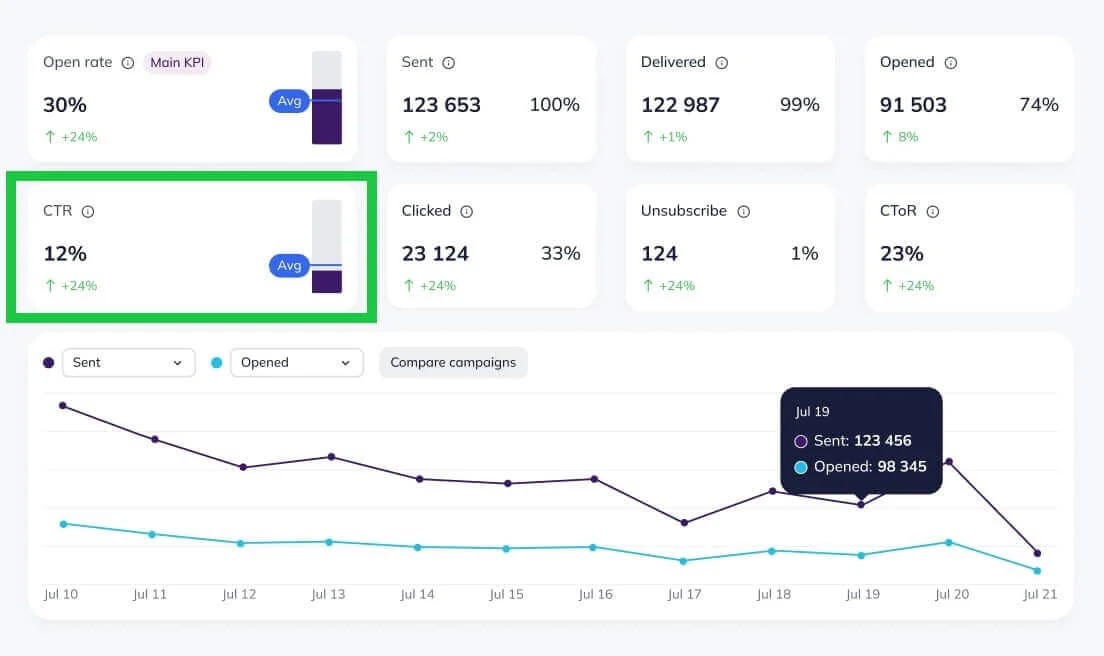
Сlick-through rate (CTR) is the percentage showing what amount of your emails, out of all the ones delivered, were clicked on.
The formula to calculate it is: Number of people who clicked on at least one link in an email / Number of deliveries x 100. In other words, it is “Unique clicks / Delivered emails”.
Since Apple made it harder to track open rates in 2021, many professionals now consider CTR the standard KPI for email marketing performance.
CTR is a great KPI as it measures engagement. If the funnel order is “open email > click on a link > purchase,” the click is a strong indicator of interest.
CTR can also be counted as unique and total clicks, with numbers for the whole email campaign and for each link in that campaign. If you go really granular with it and examine each email closely, you can see, for example:
- Where in the message do the links get more clicks (in the header, body, or footer)?
- Which link types get the most attention (text, button, or image)?
- What copy appeals most to subscribers?
What is the average CTR? The average CTR, globally, is 3.25%, and the average across different industries is 5.14%.
However, it’s best to consider the metric relevant to your industry and email type. It’s no surprise, for example, that a campaign with a strong call-to-action (CTA) or a hefty discount will get more clicks.
Conversion rate
Conversion rate measures how many people took a desired action (underwent a conversion).
The formula to calculate it is: Number of people who “converted” (for example, clicked on the CTA) / Total number of emails delivered x 100.
If the marketing team is measuring opens and clicks, at the end of the day, the KPI that usually matters most is conversion: the number of purchases, sign-ups, downloads, new clients, or feedback that the email campaign generated.
Conversion rate is the main KPI for data-driven email marketing. It is the main metric for A/B testing and long-term approaches because it ties directly to the objectives of the company.
If, for example, the objective of an email campaign is to sell a new clothing collection, conversion is the percentage of people who took action. In this case, those who bought items that made up the seasonal drop.
What is the average conversion rate? Globally, conversion rates averaged at 0.07%.
An email marketing campaign can have many goals: to sell products, engage with readers, ask for feedback, increase sign-ups, get more clients, or increase average tickets. So, the first step is to define the goal before setting the KPI.
How to measure conversion rate? A simple sequence would be:
- Define the campaign goal.
- Write the email with a great CTA.
- Track the clicks on the CTA to measure conversions, set up UTM tags, or set integrations with relevant platforms (like your e-commerce store) to get clearer data.
A great tip to increase conversion is to focus on automation: automated emails reach conversion rates up to 1.76% average, according to Omnisend.
But the fact that the campaigns are automated isn’t the end-all be-all. What’s behind this data is segmentation and personalization of the automated email journeys. Elaborate automated email campaign workflows can make your customers feel like your company relevantly and timely responds to their actions.
Using Selzy, you can set up omnichannel automation and bring even more channels like Telegram into the mix.
ROI (Return on Investment)
Return on Investment is the comparison between the revenue and costs of your marketing efforts.
The formula to calculate it is: (Revenue – Spent) / Spent x 100.
To quickly calculate the metric, use our ROI calculator. This KPI measures the effectiveness of your campaign and is a great way to compare two different campaigns with disparate costs. You can also calculate the ROI of your entire email marketing strategy (and your strategy for any other channel, for that matter) to see whether this is truly the venue you should spend your resources on.
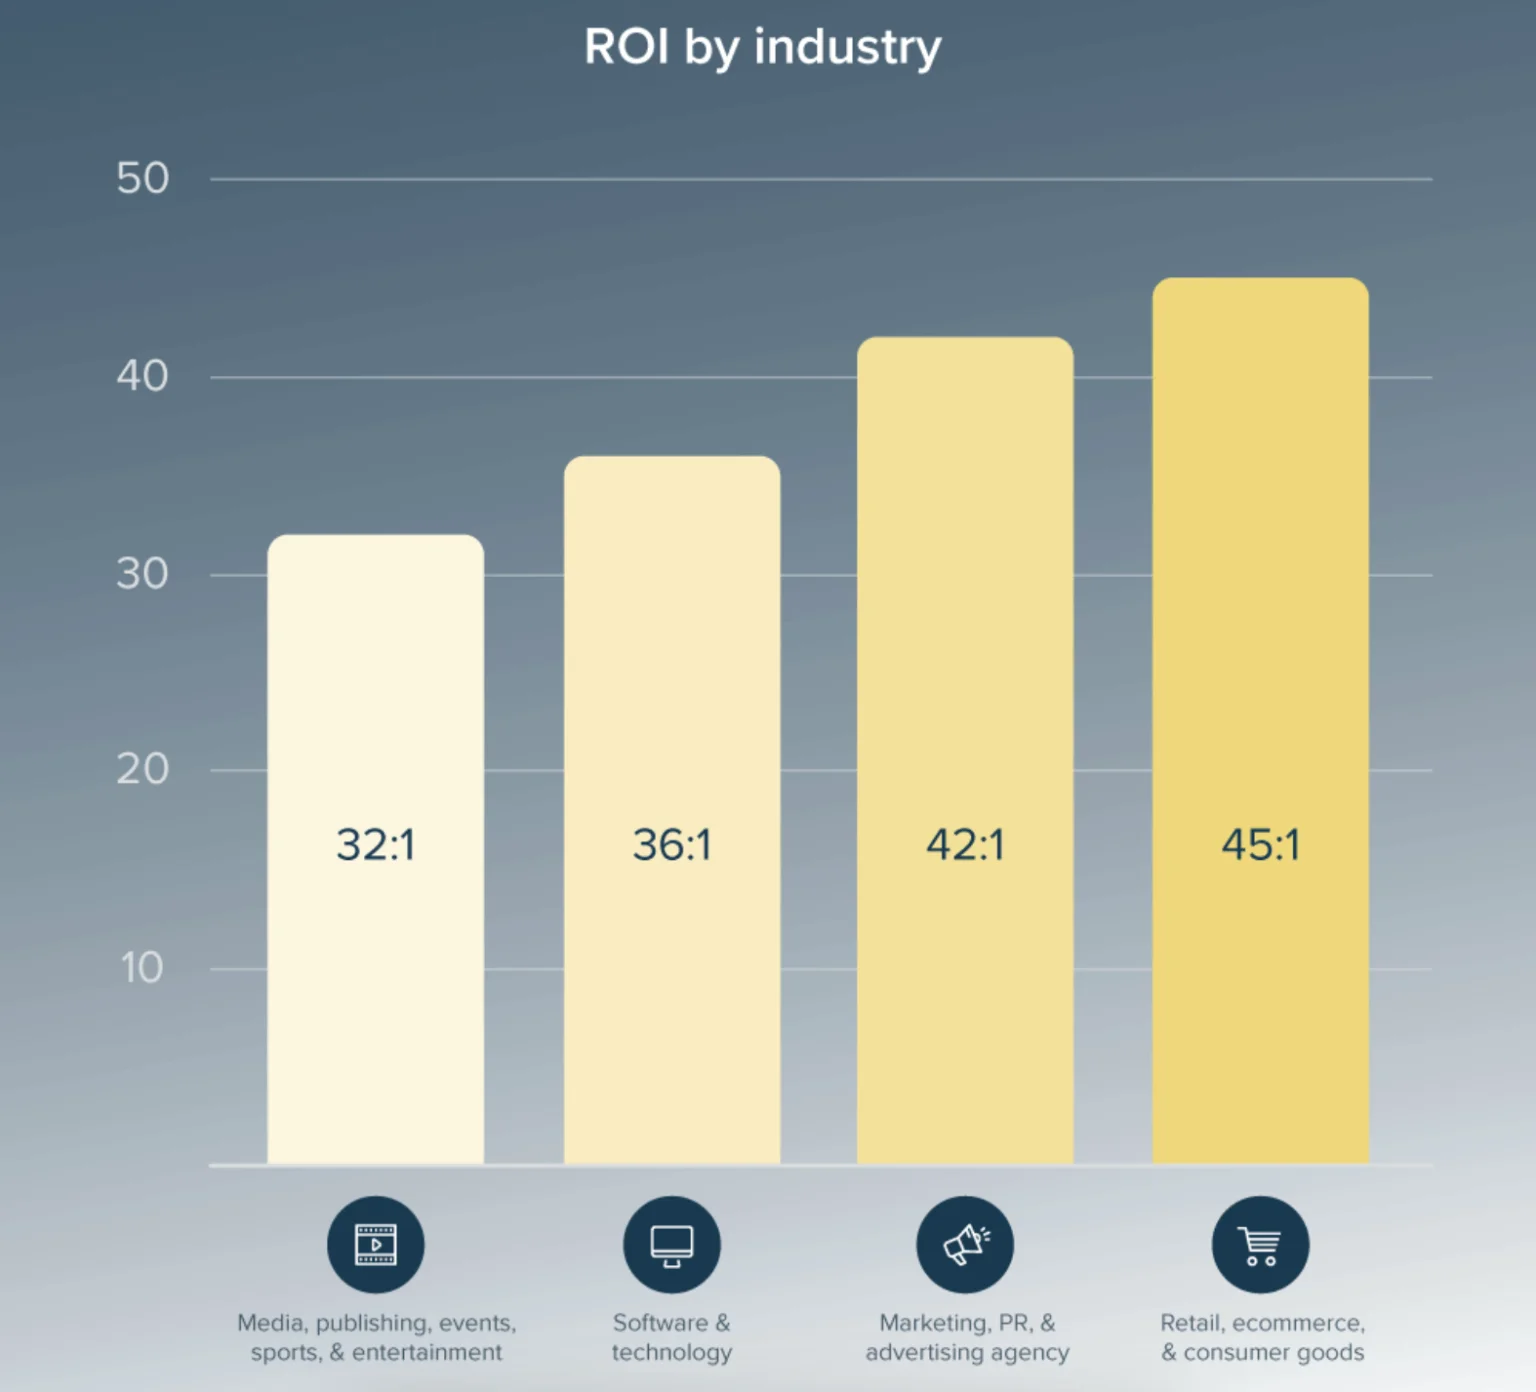
What is the average ROI? Taking email marketing efforts as a whole, the average ROI is 3600% or $36 of revenue for every $1 spent.
ROI for a company’s entire email marketing can even reach 4500%! It all depends on the industry, of course. To have a feel for a good ROI, for each dollar spent, the ROI is $32 of revenue for media, publishing, events, sports, and entertainment; $36 of revenue for software and technology; $42 of revenue for marketing, PR, and advertising services; and $45 of revenue for retail, e-commerce, and consumer goods.
ROI is important to track, but it’s best assessed as a KPI in your monthly or quarterly reviews since it is best viewed as a metric of results over time.
To increase ROI, set clear objectives, segment, personalize, and automate.
Unsubscribe rate
Unsubscribe rate is the percentage of people who unsubscribe from your newsletter after a single email.
The formula to calculate it is: Number of people who unsubscribed / Number of recipients x 100.
While you may aim for a 0% unsubscribe rate, that’s unrealistic. A growing and active email marketing list will always have people coming in and out. The main reason people unsubscribe is “too many messages from the brand,” according to Mailgun. Although on the other side, if you have a zero unsubscribe rate, maybe you’re not pushing enough and could be getting more from each email.
What is the average unsubscribe rate? The average global unsubscribe rate is 0.15%, and the average across industries is 0.14%.
Financial services enjoy the lowest unsubscribe rate of 0.08% while healthcare has the highest average of 0.21%.
List growth rate
List growth rate is the percentage of new subscribers after each campaign.
The formula to calculate it is: (New subscribers – Unsubscriptions) / Delivered emails.
List growth shows how your audience is getting bigger: it counts new subscribers, excluding those who unsubscribed or bounced. To maintain a long-term, stable email marketing program, you need a strong growth rate, meaning getting more subscribers than losing.
This is an important KPI for new projects or brands that are just starting to send their email marketing campaigns. If you’re starting from zero, it is important to invest in creating an audience and growing your list to get a better ROI for your marketing efforts.
Email sharing (forwarding) rate
Forwarding rate is the percentage of subscribers who share your email with another person.
The formula to calculate it is: Number of forwards / Number of delivered emails.
This rate varies a lot and can be measured by your ESP.
It can be an interesting KPI for awareness campaigns, especially if the CTA asks to forward the information to a friend.
Revenue
Revenue measures the amount of money email marketing (overall or per campaign) brings to your business.
Revenue is a KPI for every business, but how do you measure it in email marketing? In a way, revenue is similar to ROI, as it ties with the hard reality of money going in and out, instead of more abstract marketing metrics.
The trick to using revenue as a metric is to be specific. There are three ways to measure revenue effectively:
- Revenue per recipient: Similar to ROI, it groups the revenue and divides it by the number of campaign opens.
- Revenue per click: Great to test the performance of a landing page or CTAs, as it measures the revenue only for those who clicked on a link.
- Subscriber Lifetime Value (LTV): This is a long-term KPI metric that tries to answer a hard question: how much is a client worth? Use our LTV calculator to measure your results and start tracking them.
How to decide which metrics to track?
In email marketing campaigns, everything is trackable. This, of course, leads to a vital question: Should I track everything?
If you try to track everything, chances are that you end up optimizing for the wrong metrics (not to mention feeling extremely overwhelmed). To choose the right KPIs for your email marketing campaigns, look at your business objectives.
- What are your business goals in the short and long run?
- What are the objectives for this specific email marketing campaign?
Make the answers to these two questions the forefront of your decision-making process. This will help you assign the KPIs to watch closely.
In marketing or business planning, select two or three main KPIs and leave the others in the background, like in a “just for info” section. That is, don’t optimize for those secondary metrics, but keep an eye on them to track the overall email marketing campaign health. These other email marketing metrics can raise alarms if they start to go way off, like the bounce rate getting higher.
Conclusion: The most important KPIs for email marketing are the ones that align with your goals
Let’s recap the important metrics in email marketing and what they do:
- Delivery rate, bounce rate, list growth rate, and unsubscribe rate measure the health of your list and your email marketing program. Monitor them to see if your emails are getting delivered and not marked as spam. These are important to get the benefits of the channel in the long run.
- Open rate, click-through rate, and forwarding rate measure the engagement of your readers with the content. Focus on these KPIs to see if your email campaigns are being welcomed and whether they spark curiosity and interest, the first step towards conversion.
- Conversion rate, ROI, and revenue measure the concrete return the campaigns bring to your company. These are metrics that tie directly to the bottom line and show if and how your email marketing campaigns are putting bread on the table.
When you know about each important KPI in email marketing, it’s easier to select those you’ll watch closely.
