Subscriber behavioral data like devices, location, and opens over time, is available in the detailed campaign report.
You can find this report in the History section.
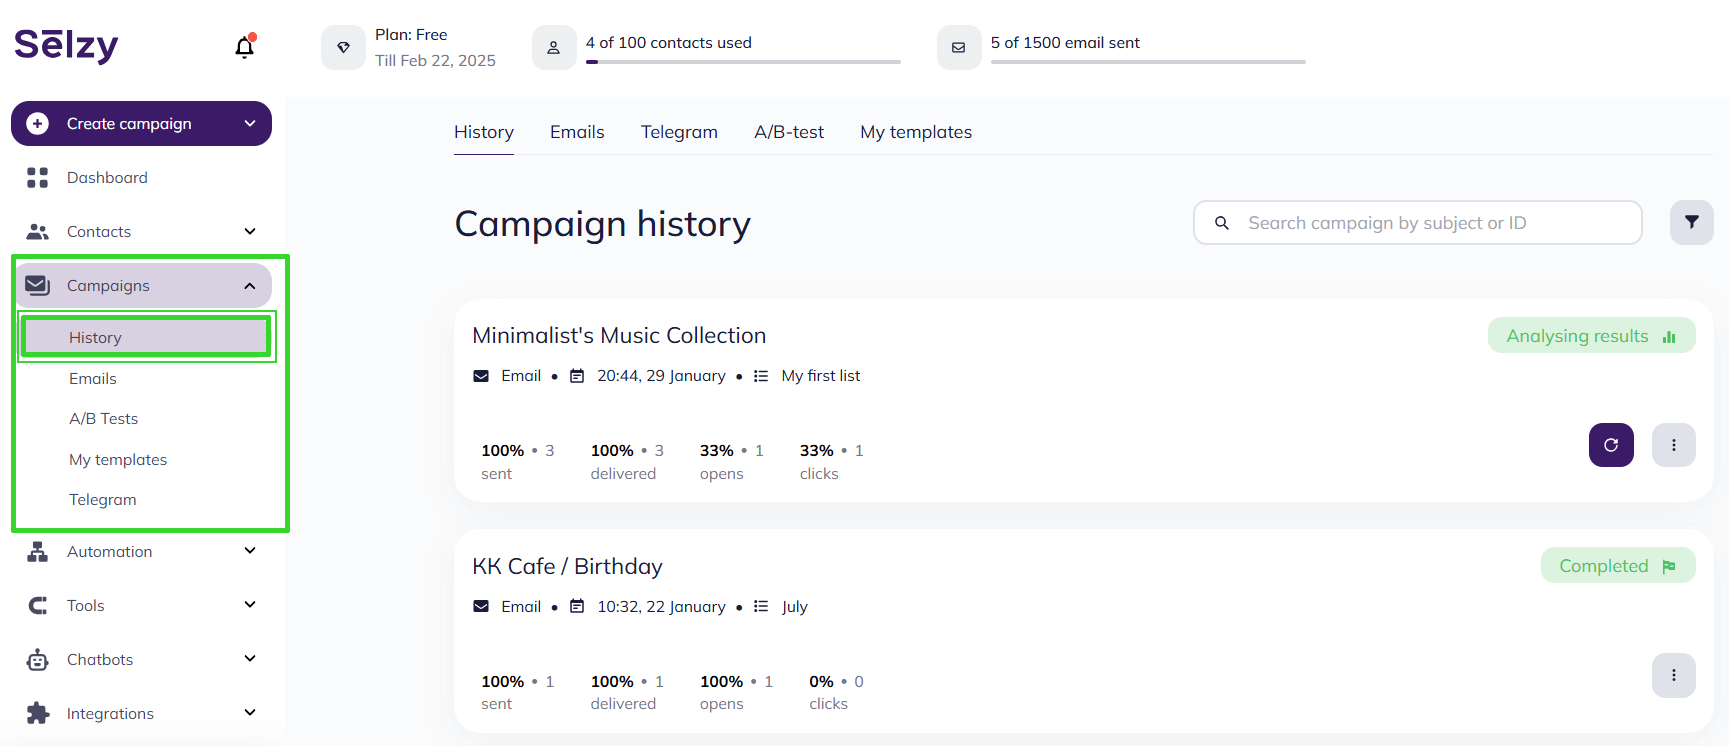
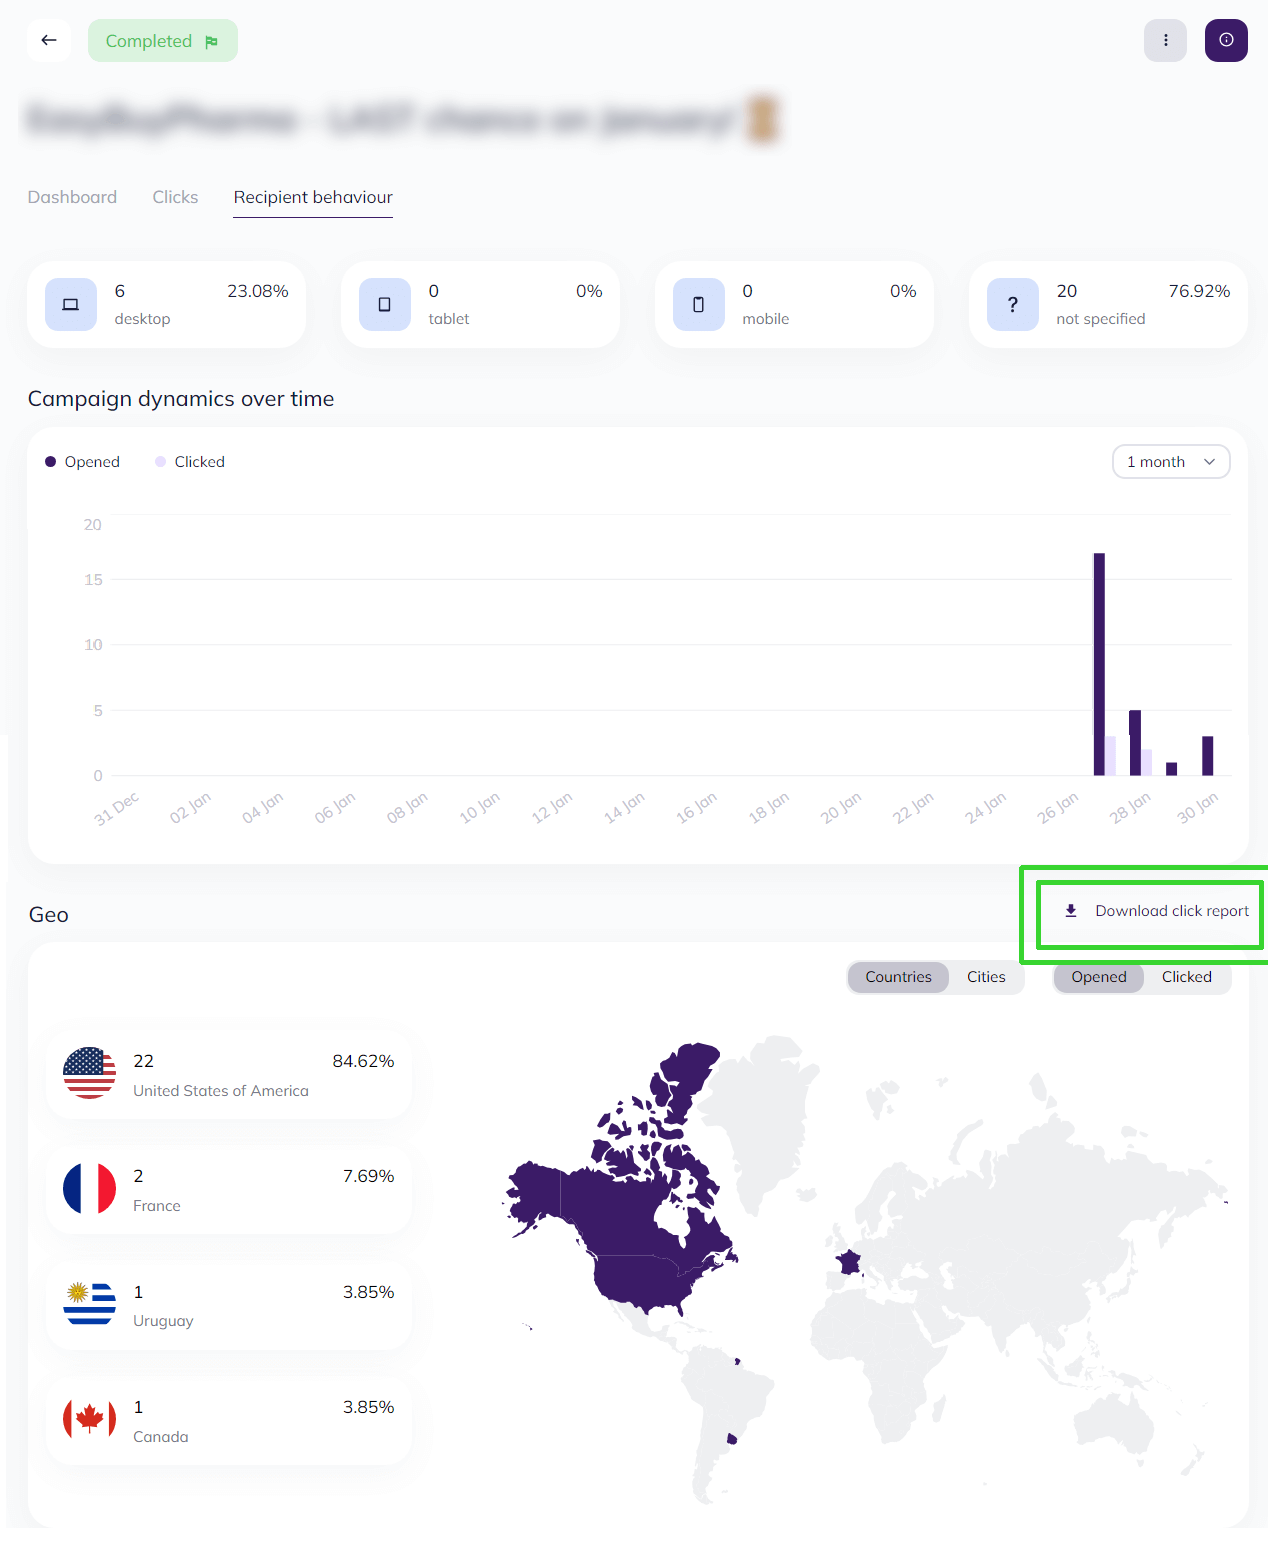
Click on the name of the campaign you need and go to the Recipient behavior tab.
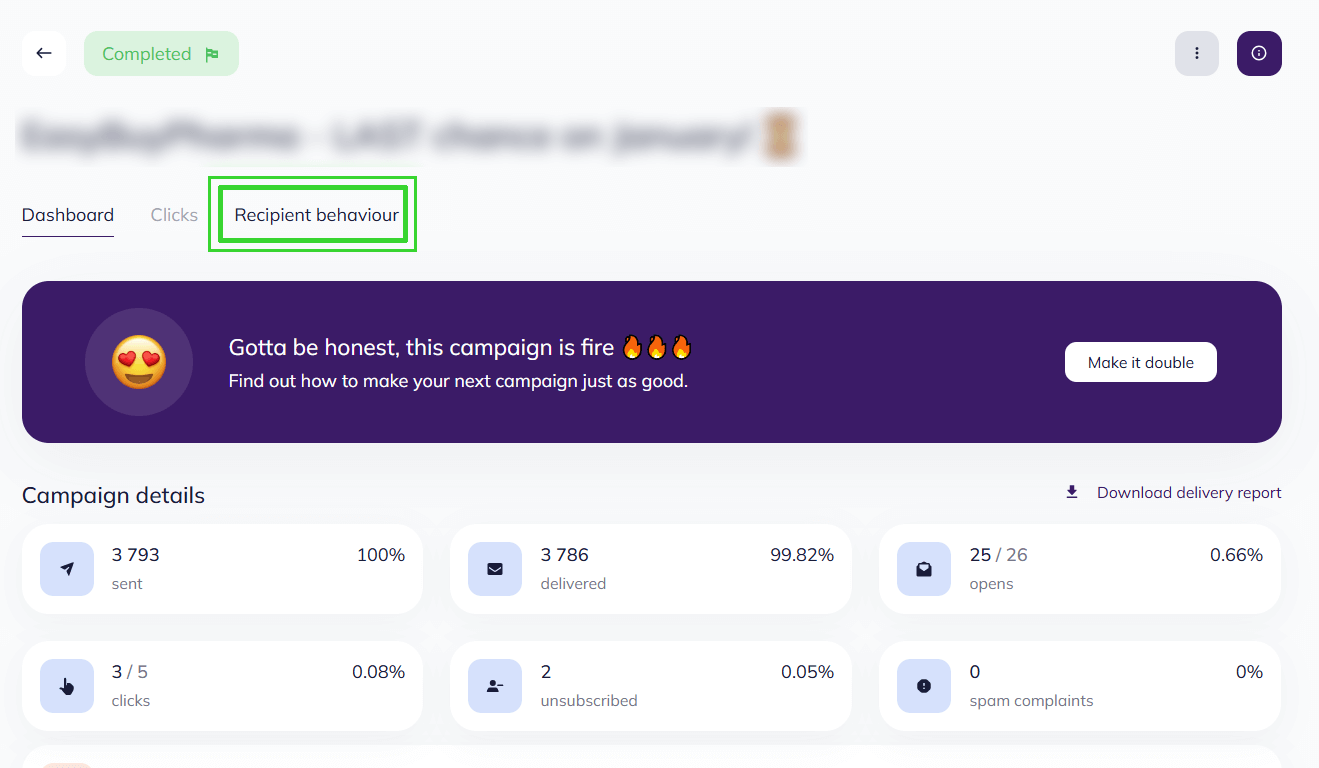
In the tab, you will find:
- the devices used to open your emails
- the campaign dynamics over time i.e. the number of opens and clicks in 24 hours, 7 days, 14 days, and 1 month
- a geographical map of opens and clicks
In the same tab, you can also download the click report. Generating the report takes a few minutes, after that it will be sent to your email and in notifications (🔔).
Devices used to open emails
Selzy tracks the devices used by recipients to open your emails. With this information, you can identify the most popular devices and tailor your campaign's design and content accordingly.
If at least 20% of recipients open your emails on smartphones, it’s important to make your emails mobile-friendly.
How to optimize emails for mobile devices
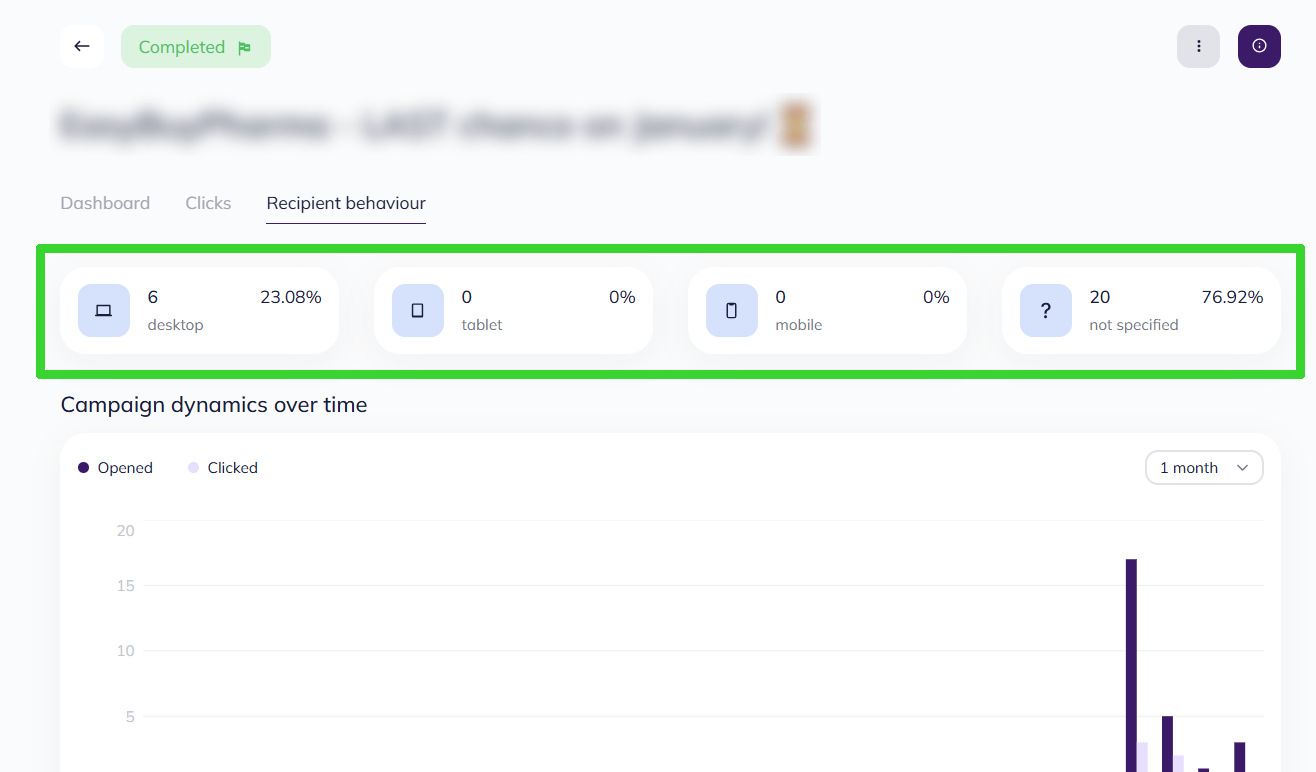
Certain devices either don't report their identity or provide incorrect information. As a result, these devices are labeled as ‘not specified’ in the report.
Campaign dynamics over time
The chart helps you identify the most popular times your recipients open emails and the number of days when most of them engage with the campaign.
You can analyze the dynamics of opens and clicks over a day, a week, 14 days, or a month.
The dark purple bar represents the number of opens, while the light purple bar represents the number of clicks on links. The exact number of opens/clicks is shown when you hover over the bar.
The 'over a day' chart can help you find the best time to send your emails.
Geographical map of opens and clicks
The geographical map helps you analyze which countries and cities open your campaigns, assess subscriber engagement from different regions, and find the best time to send your emails based on the time zones of most of your audience.
On the map, you can view data on cities, countries, opens, and clicks separately. Use the settings above the map to switch between data sets.
The recipient's region is determined by their IP address. If this information is hidden, you'll see some subscribers labeled as 'non-specified' on the map.