Selzy uses redirect tracking to collect click data from sent campaigns. When a subscriber clicks a link, they are briefly redirected through a tracking URL before reaching the target website. That way, click data is captured without any noticeable delay.
Tracking URLs are automatically generated when you send your campaign. However, they are not applied to the following types of links:
- Mailto: email address — the link to an email address that opens the reply page.
- Tel:+1234567890 — the link to a phone number, which allows you to make a call when you click on it.
- SMS:+1234567890 — the link to a phone number, which allows you to send an SMS when you click on it (please note that mailing services don’t usually support such links).
- Web-version of the email and links on the web-version page — for the web-version to work, the tag {{WebLetterUrl}} is added to the link field. This tag will be replaced with the link to the email when the campaign is sent.
- Unsubscription link — when the recipient clicks on this link, they get unsubscribed from your future campaigns.
- Link to the attachment — the link to the file added as an attachment to an email through Selzy. To enable redirect tracking, add a cloud storage link to your file, such as Google Drive.
- Link to subscribe to a specific mailing list — the link is added through the tag {{SubscribeListUrl:NNN}}, where NNN is the list ID.
If you add UTM tags to your links (manually or through integration with Google Analytics), you will be able to track subscriber behavior on your website and learn what pages they viewed, how much time they spent on the website, and what they ordered.
Set up Google Analytics for email campaigns
With Selzy, you can track not only the number of clicks but also see which contacts clicked specific links, their country and city, the time of the click, and which links received the most clicks.
Learn who clicked links
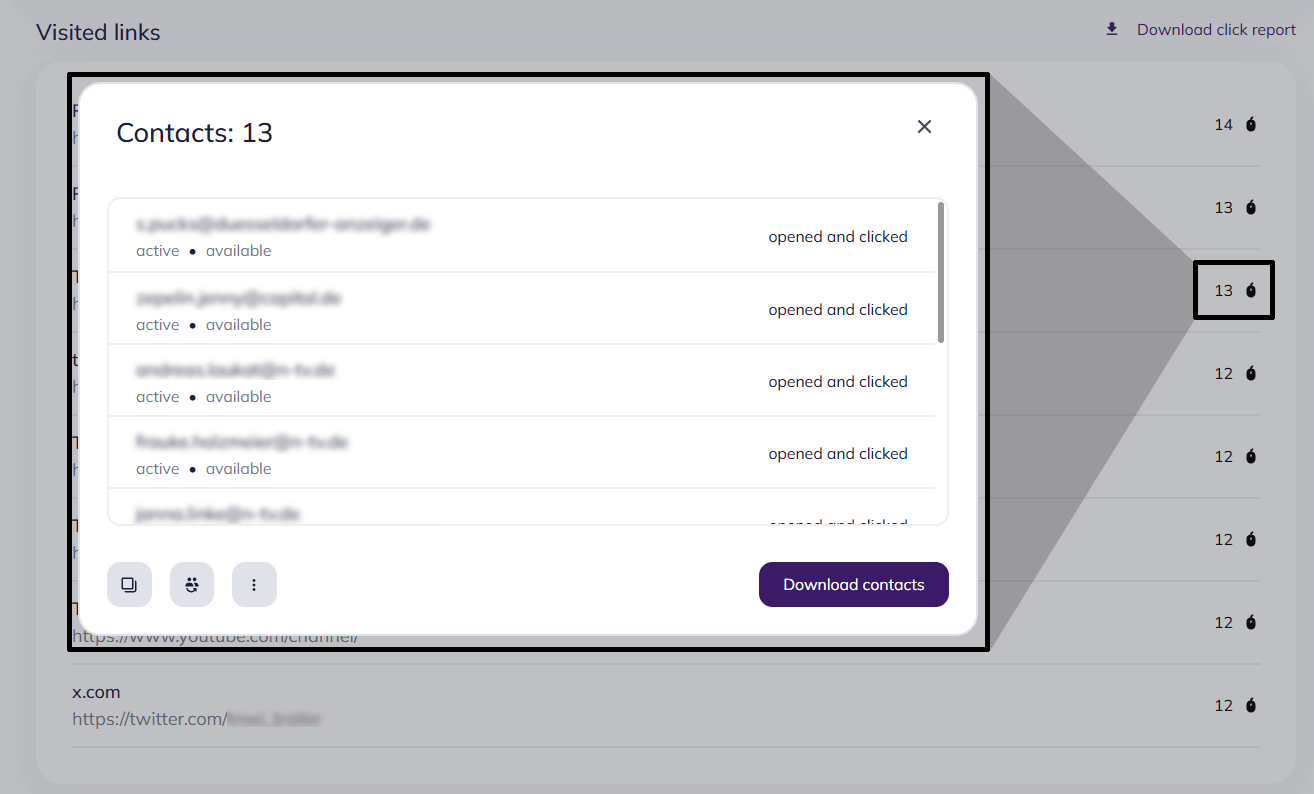
To view the list of subscribers who clicked links in any of your campaigns, go to Dashboard and scroll down to find the campaign you're interested in. Then, click on the number of clicks. A list of unique contacts who clicked links will appear in a popup:
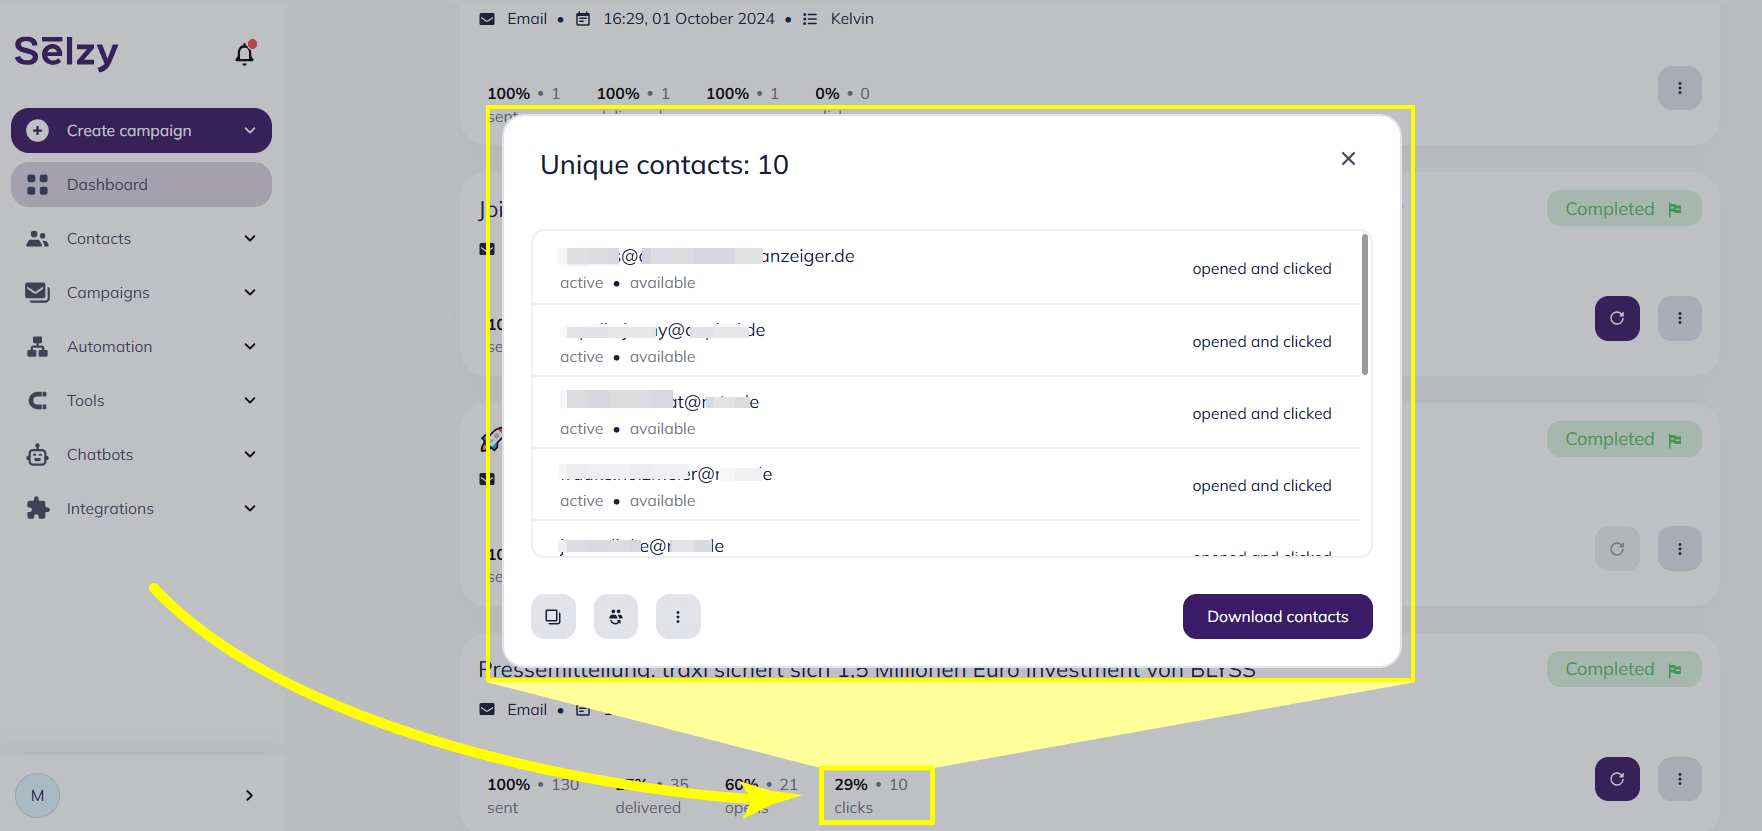
Alternatively, you can access the list in Campaign history and by viewing a detailed report for each campaign.
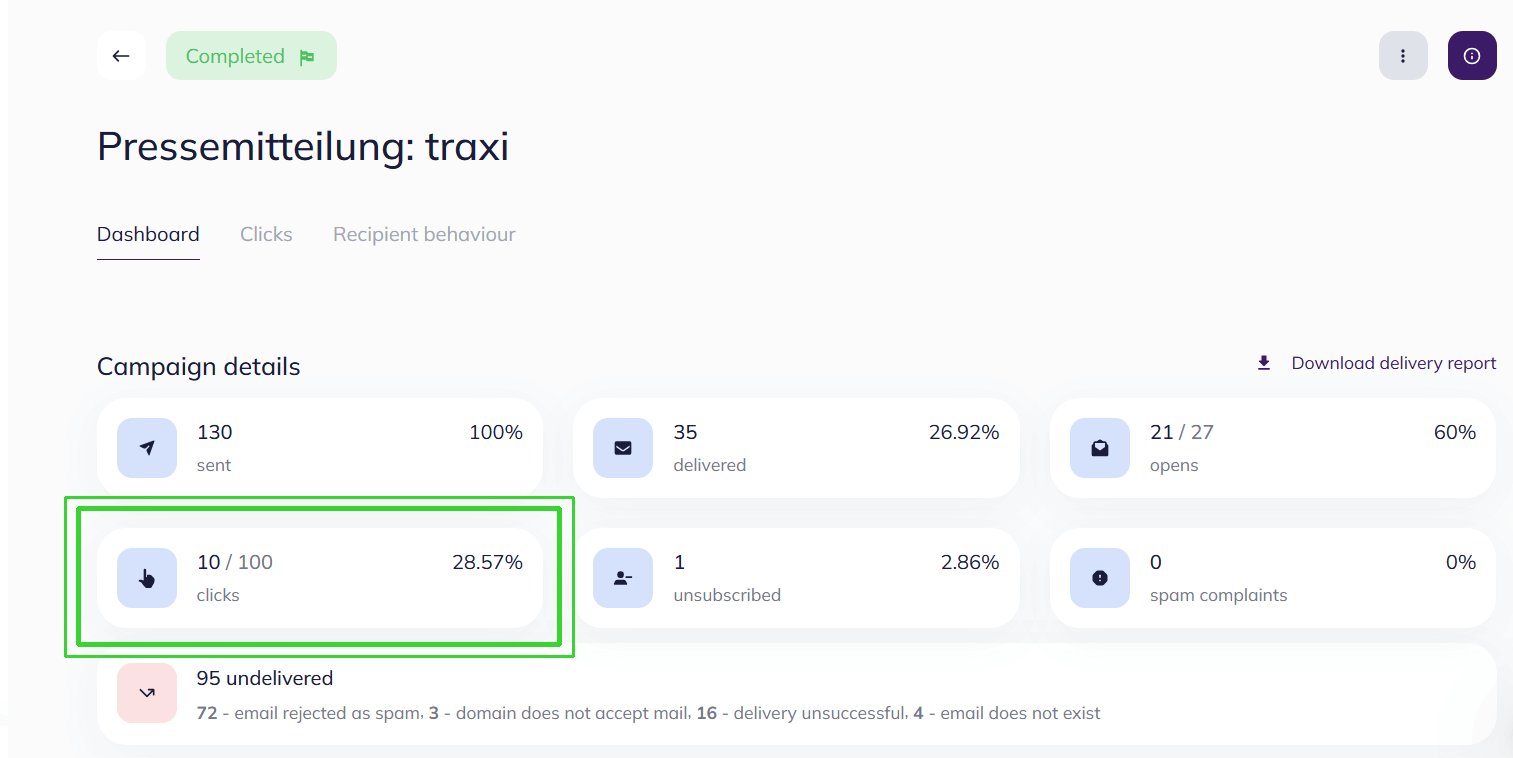
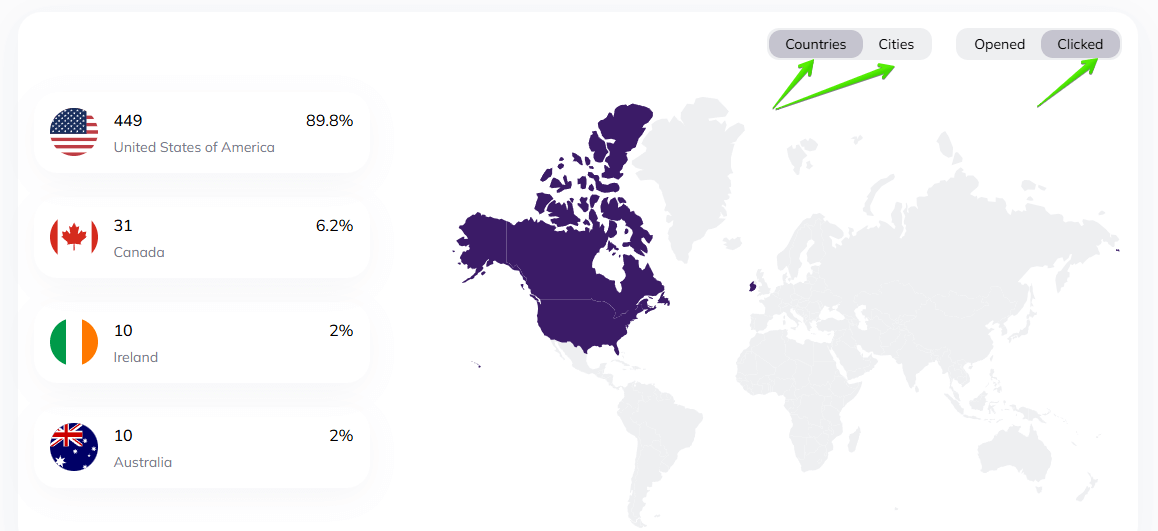
To find out where your most active subscribers live, check the location data. Go to the Recipient behavior tab in the campaign's detailed report, then select Clicks and choose either Countries or Cities.
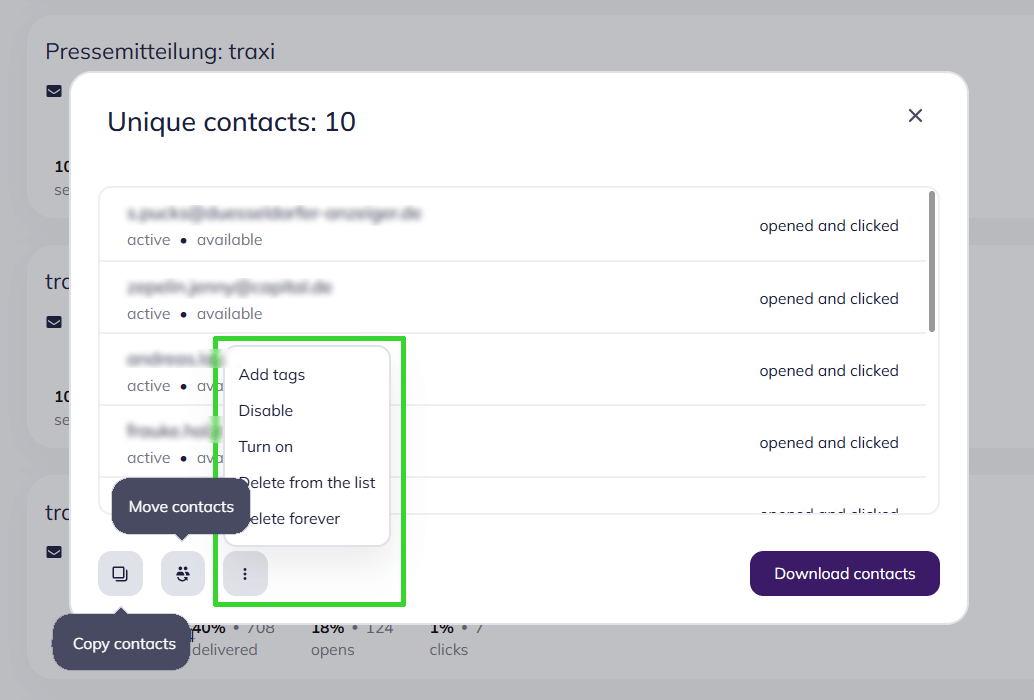
Manage the list of subscribers who clicked links
In the popup with a list of unique contacts who clicked links in the selected campaign, you can also:
- Download contacts.
- Copy or move contacts to a different list, for example, to segment out your active subscribers.
- Add tags, for example, to mark active contacts and follow up with a special offer.
- Turn contacts on or off, for example, to temporarily deactivate the group of active subscribers.
- Delete contacts from the list or from all lists at once.
Click map
Click map displays the number of clicks each tracking link has received.
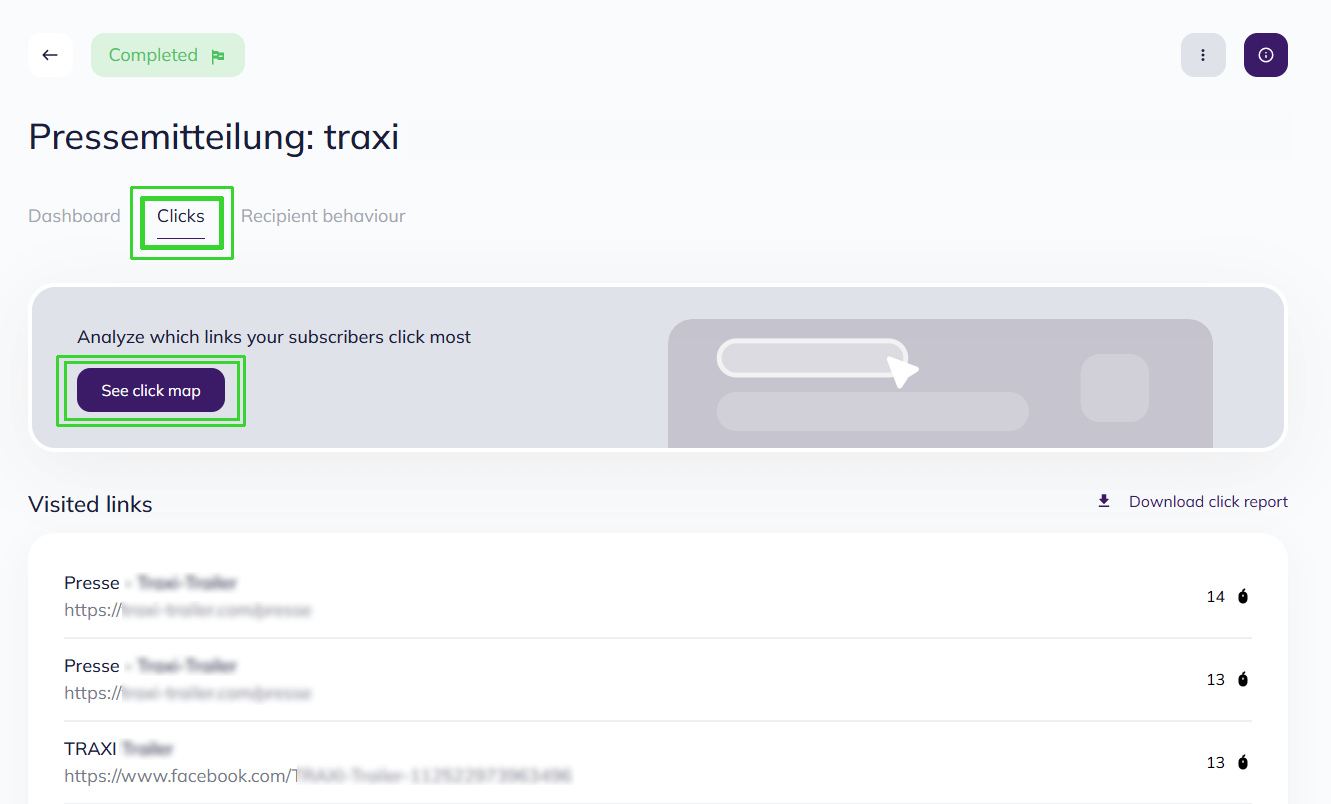
To access the click map, open the detailed report of the chosen campaign and select Clicks. Click See click map.
This action will open the sent email with the click map overlay.
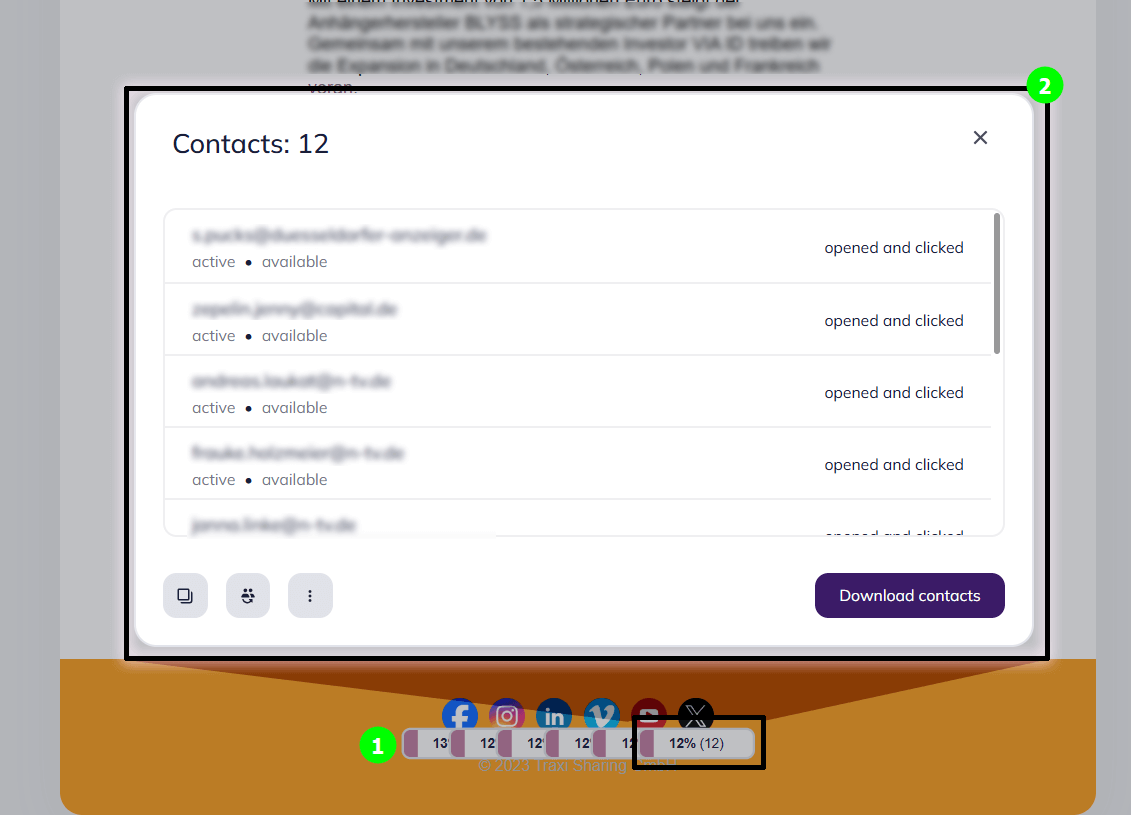
Each element with a tracking link has a bar indicating its click rate. (1)
The percentage rate shows how clicks on this link compare to the total number of clicks in the email, with the number of clicks in brackets.
The bars are clickable, allowing you to see the contacts who engaged with that specific link. (2)
Alternatively, you can scroll through Visited links in the same Clicks tab, to see how many subscribers clicked which links in the campaign.
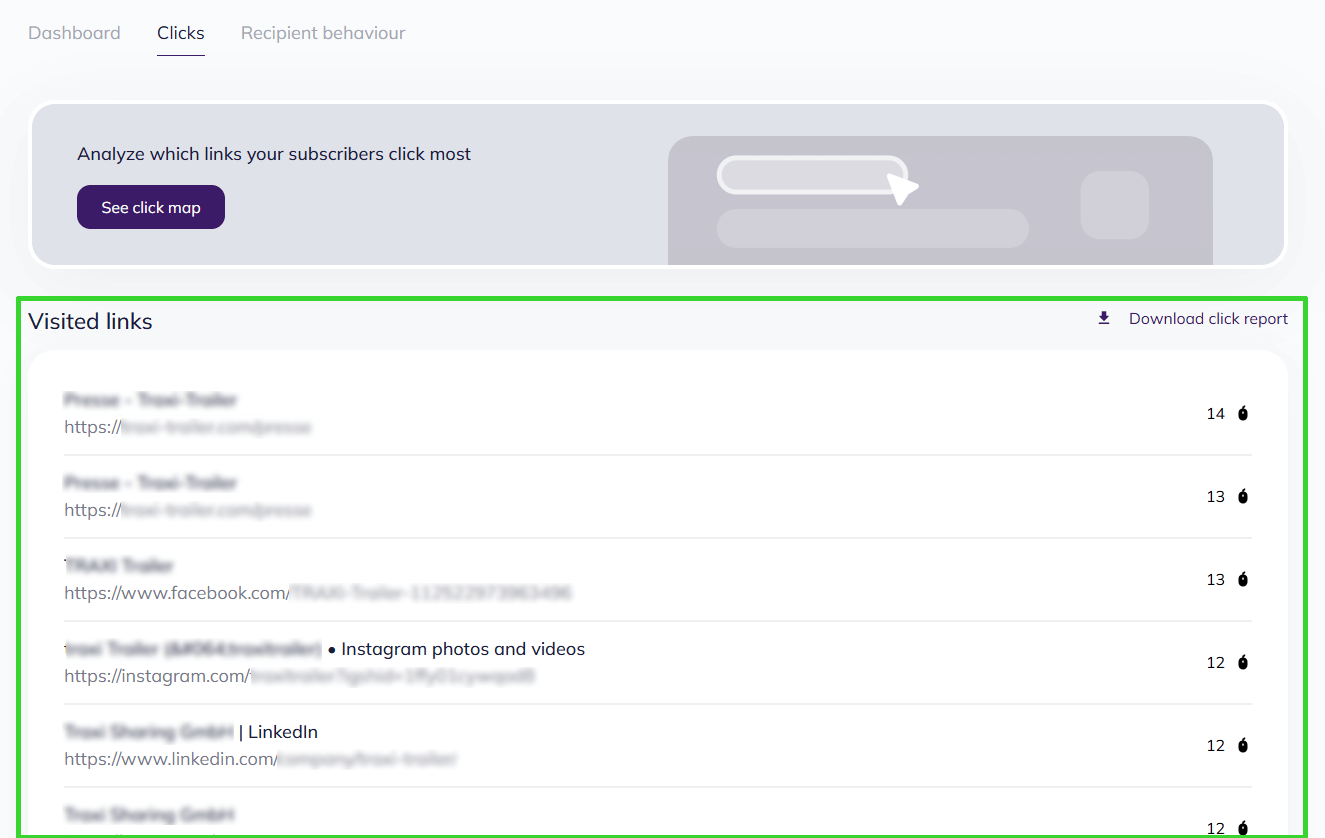
To view the list of subscribers who clicked a specific link, click the number of clicks next to that link.
Learn when links got most clicks
To view when your subscribers clicked the links in your campaign, check the chart with the campaign dynamics over time.
To access the chart, go to the detailed report for the specified campaign, select the Recipient behavior tab and scroll down to Campaign dynamics over time.
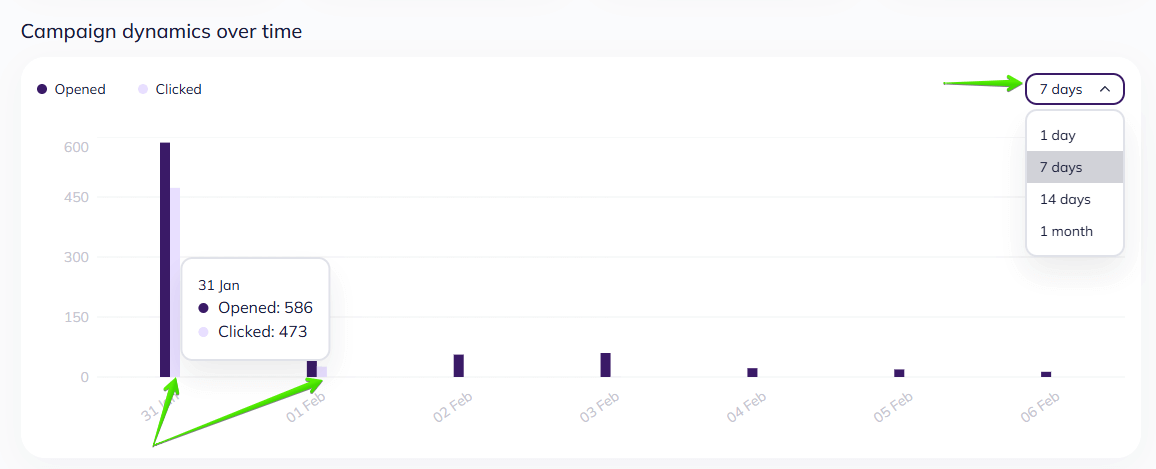
The light purple bar represents the number of clicks on links. The exact number of clicks is shown when you hover over the bar. You can choose a period to display: 1 day, 7 days, 14 days, or 1 month.
Download click report
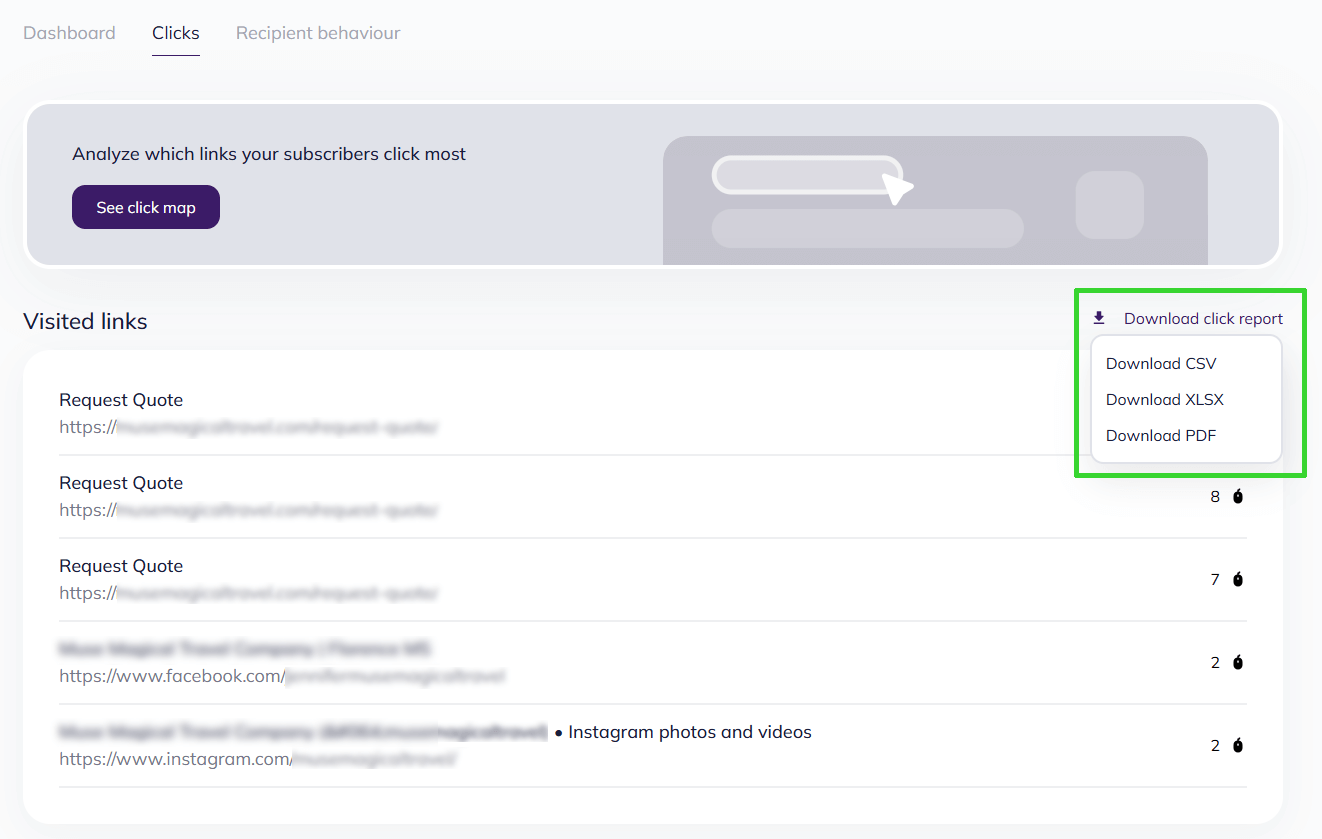
Click data can be exported. Go to History and select your desired campaign. Navigate to Clicks tab and next to Visited links, click Download click report. Choose between CSV, XLSX, and PDF formats.
The report will be generated within a few minutes and then sent to your email and in notifications (🔔).
PDF report has two pages.
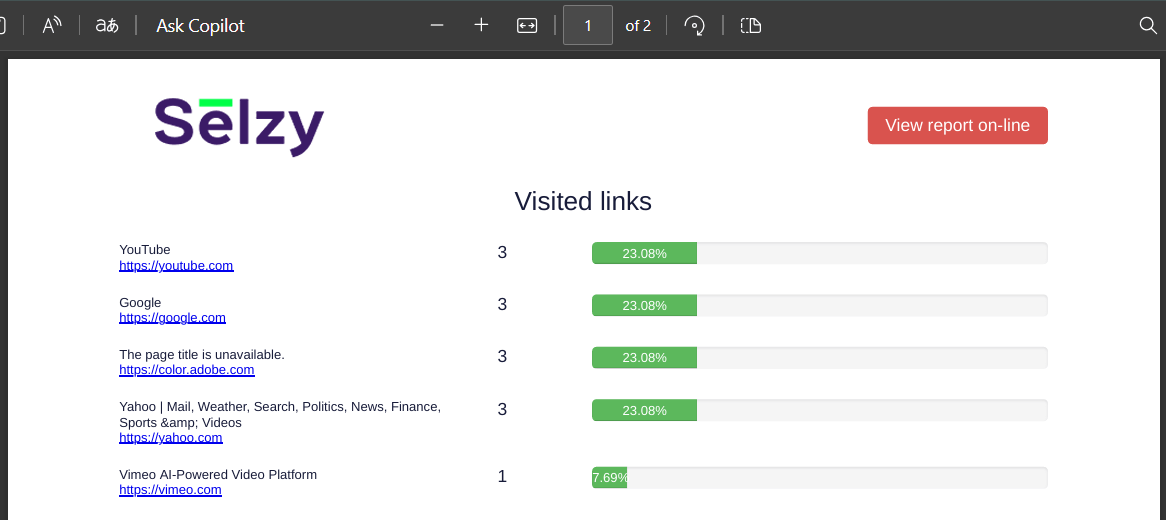
List of clicked links with the exact number of clicks and their percentage rates
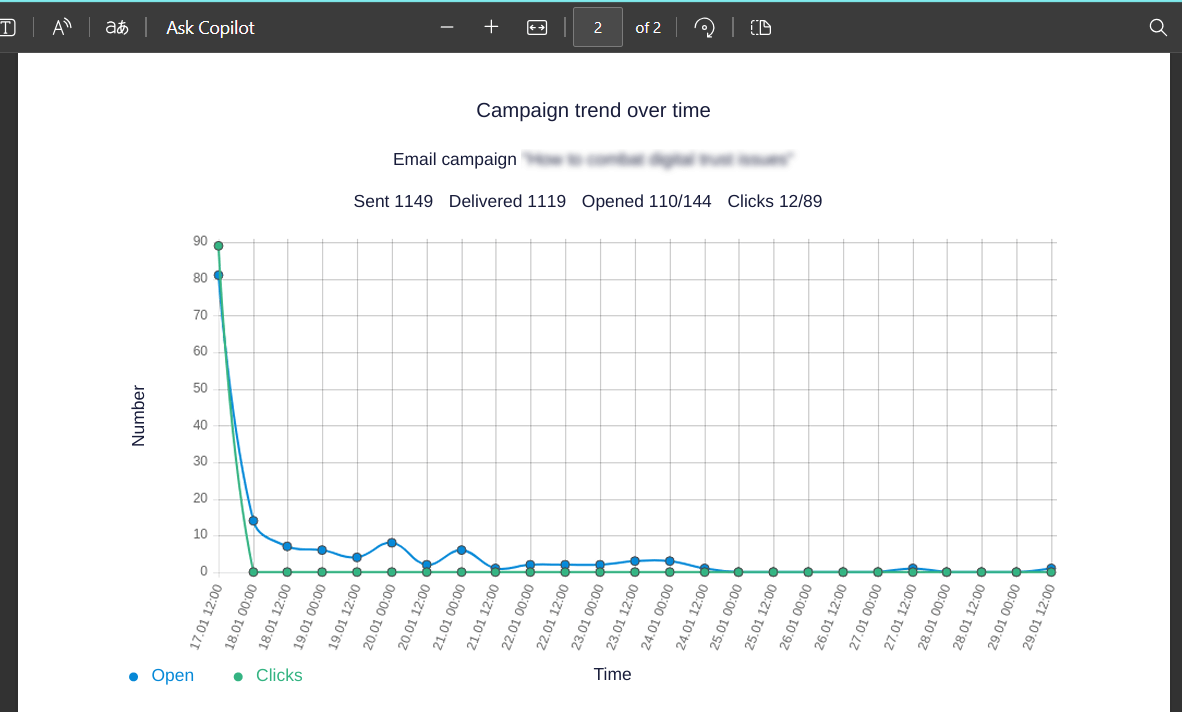
A chart displaying campaign dynamics over time
CSV and XLSX reports include a detailed table that lists all clicks, including repeated ones.
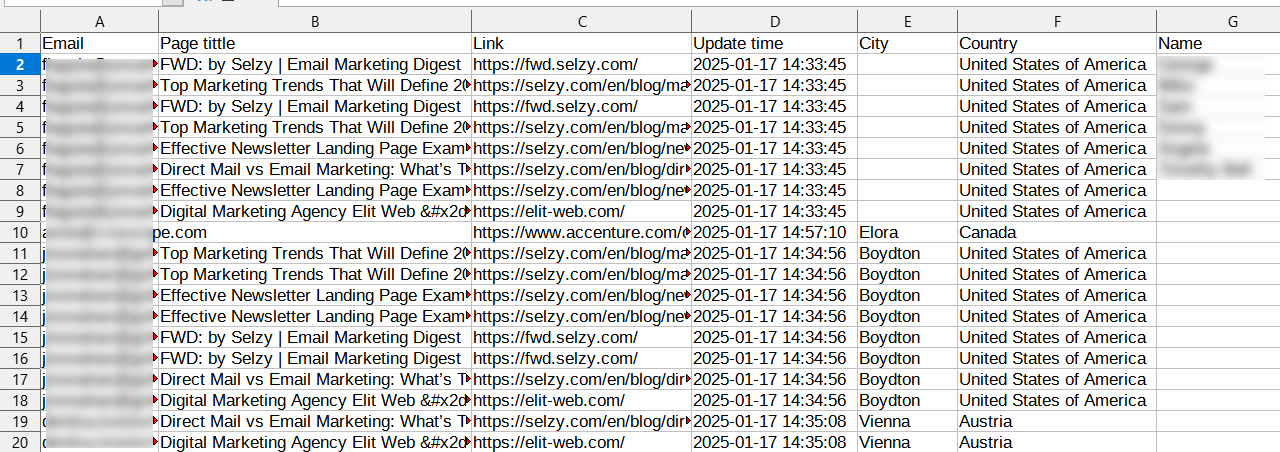
In CSV and XLSX reports, you will find: who clicked the links; which links were clicked; the time of each click; the country and city of the click; additional subscriber information