To analyze your campaign performance, it might sometimes be not enough to assess one, two, or several emails separately. You can get a lot of useful information if you analyze aggregate statistics on all your campaigns.
To get access to the aggregate statistics, click on the More button in the Last 30 Days Stats section on your account’s Dashboard.
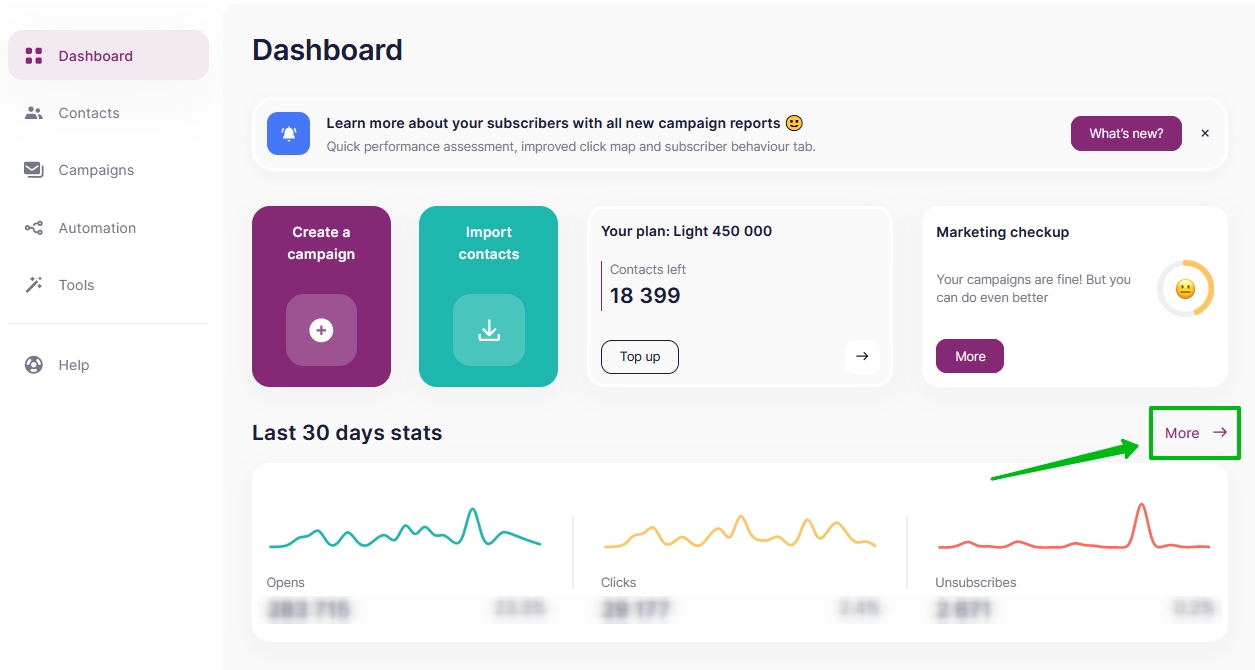
You can also get to the aggregate statistics from Tools — Last 30 Days Stats.
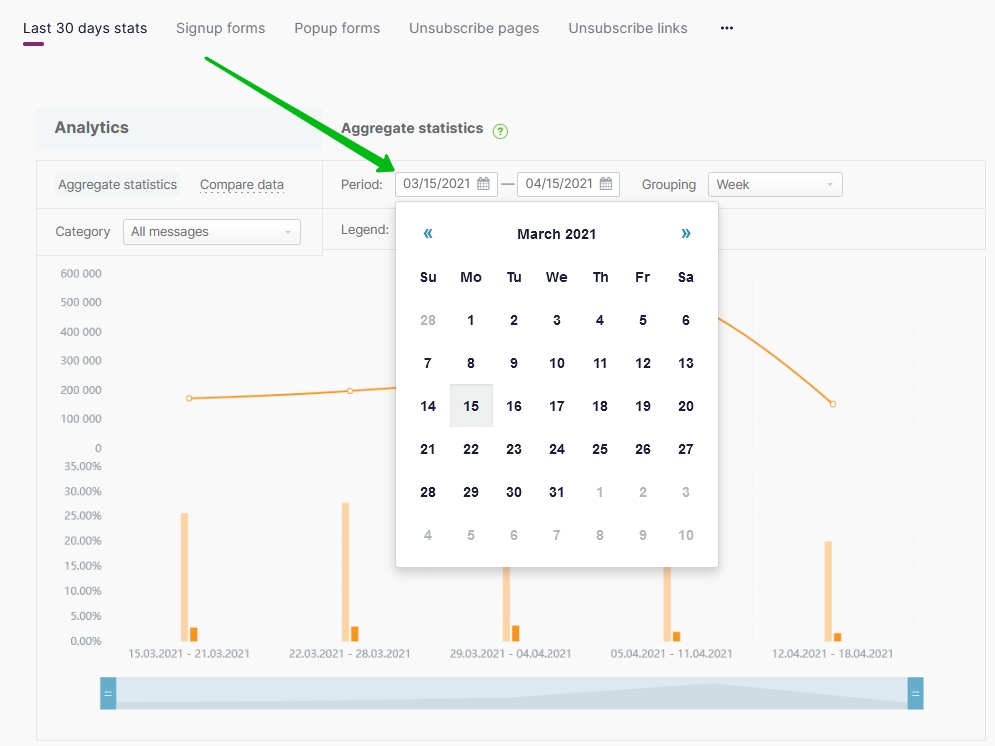
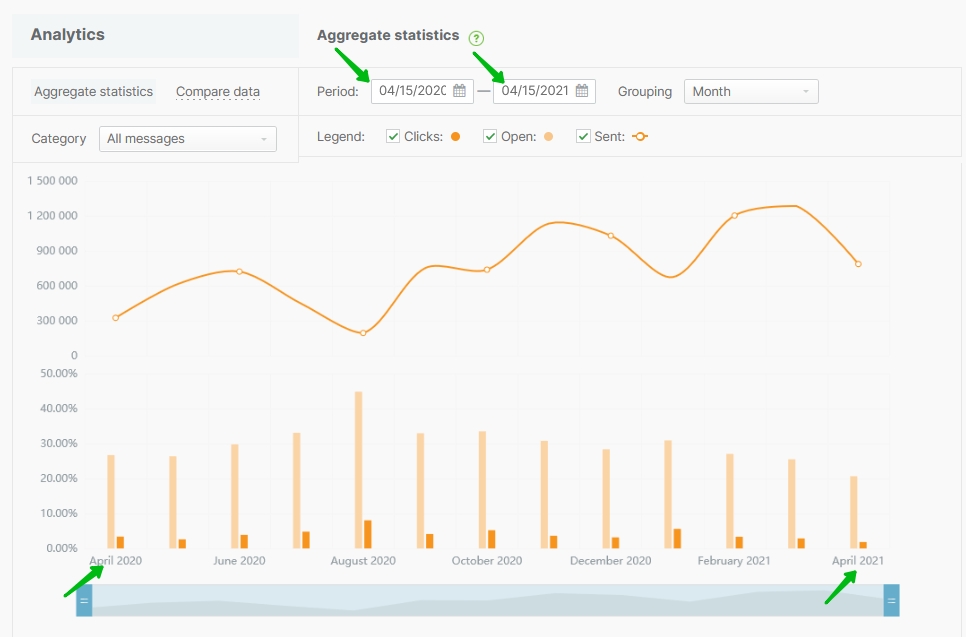
First, choose a period for analysis.
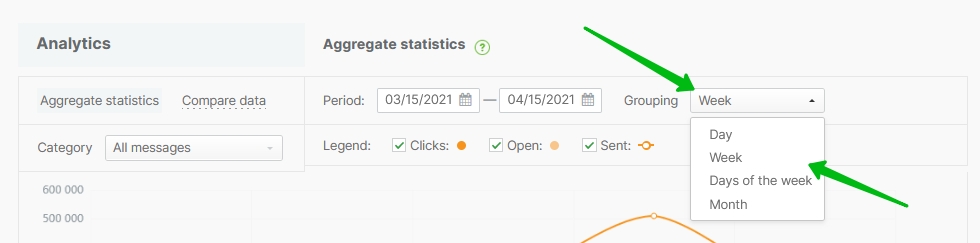
Then choose the grouping needed. You can group the data in days, weeks, months, or weekdays. So, if you group the data in weekdays, you can get on which days you have sent the largest number of emails within the chosen period and if there is any difference in opens and clicks between weekdays and weekends.
The chart shows the aggregate data on deliveries, opens and clicks for all the emails within the given period. The information is represented by columns and by a curve. The curve shows the total number of emails sent, and the columns - the percent rate of opens and clicks.
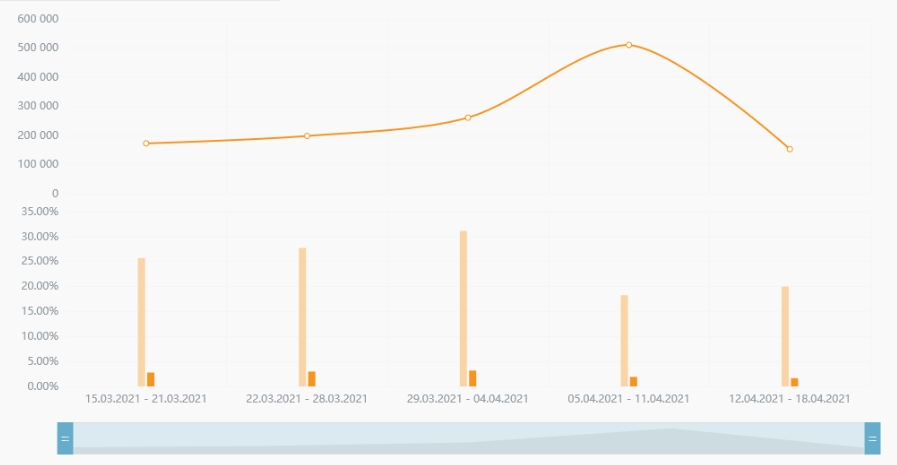
To see the figures, point your cursor at the part of the chart you are interested in.
In the drop-down menu you will find the data in the following order: the number of emails sent, the number of opens, the number of clicks. Here you will also see a percent rate of clicks and opens to all the emails sent.
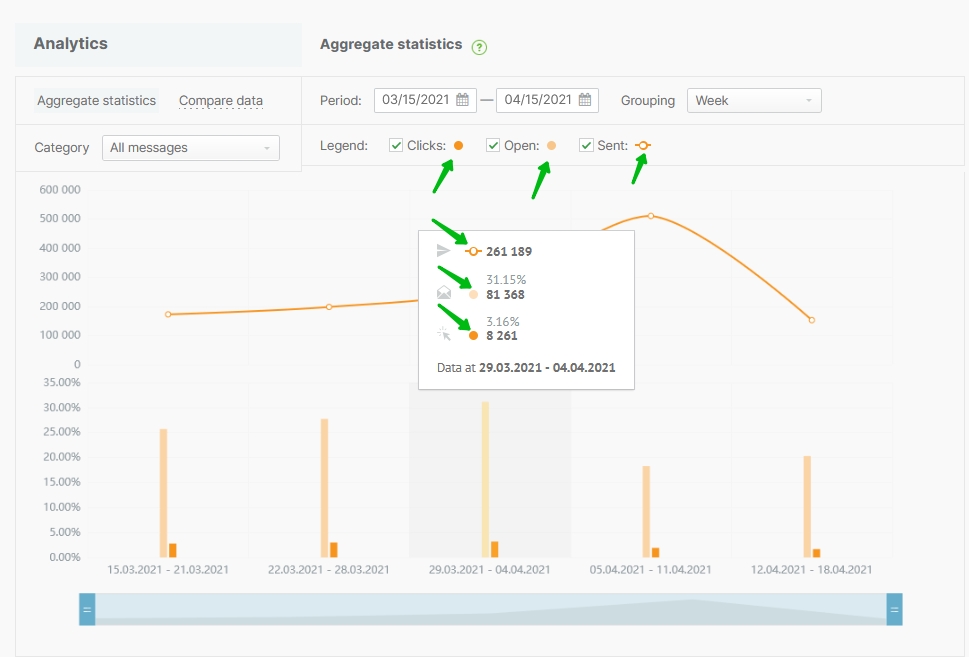
For your convenience, you can choose the metrics to be displayed in the chart.
Besides, there is a slilder below the chart that can be used to study a particular part of the chosen period. For example, the first week of the month.
With aggregate statistics, it’s convenient to analyze the dynamics of opens, clicks, and sends over a year or even several years, to trace your progress.
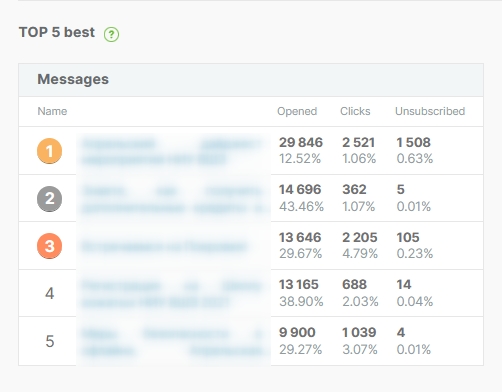
On the same page below the chart, there is your Top-5 best campaigns within the chosen period.