


Selzy helps you create, send, and analyze your emails, but the platform has even more to offer! Apart from the dashboard, Selzy has powerful email marketing automation tools for welcome emails, Telegram chatbots, and more — all running in the background while you focus on other tasks.
What is a marketing dashboard?
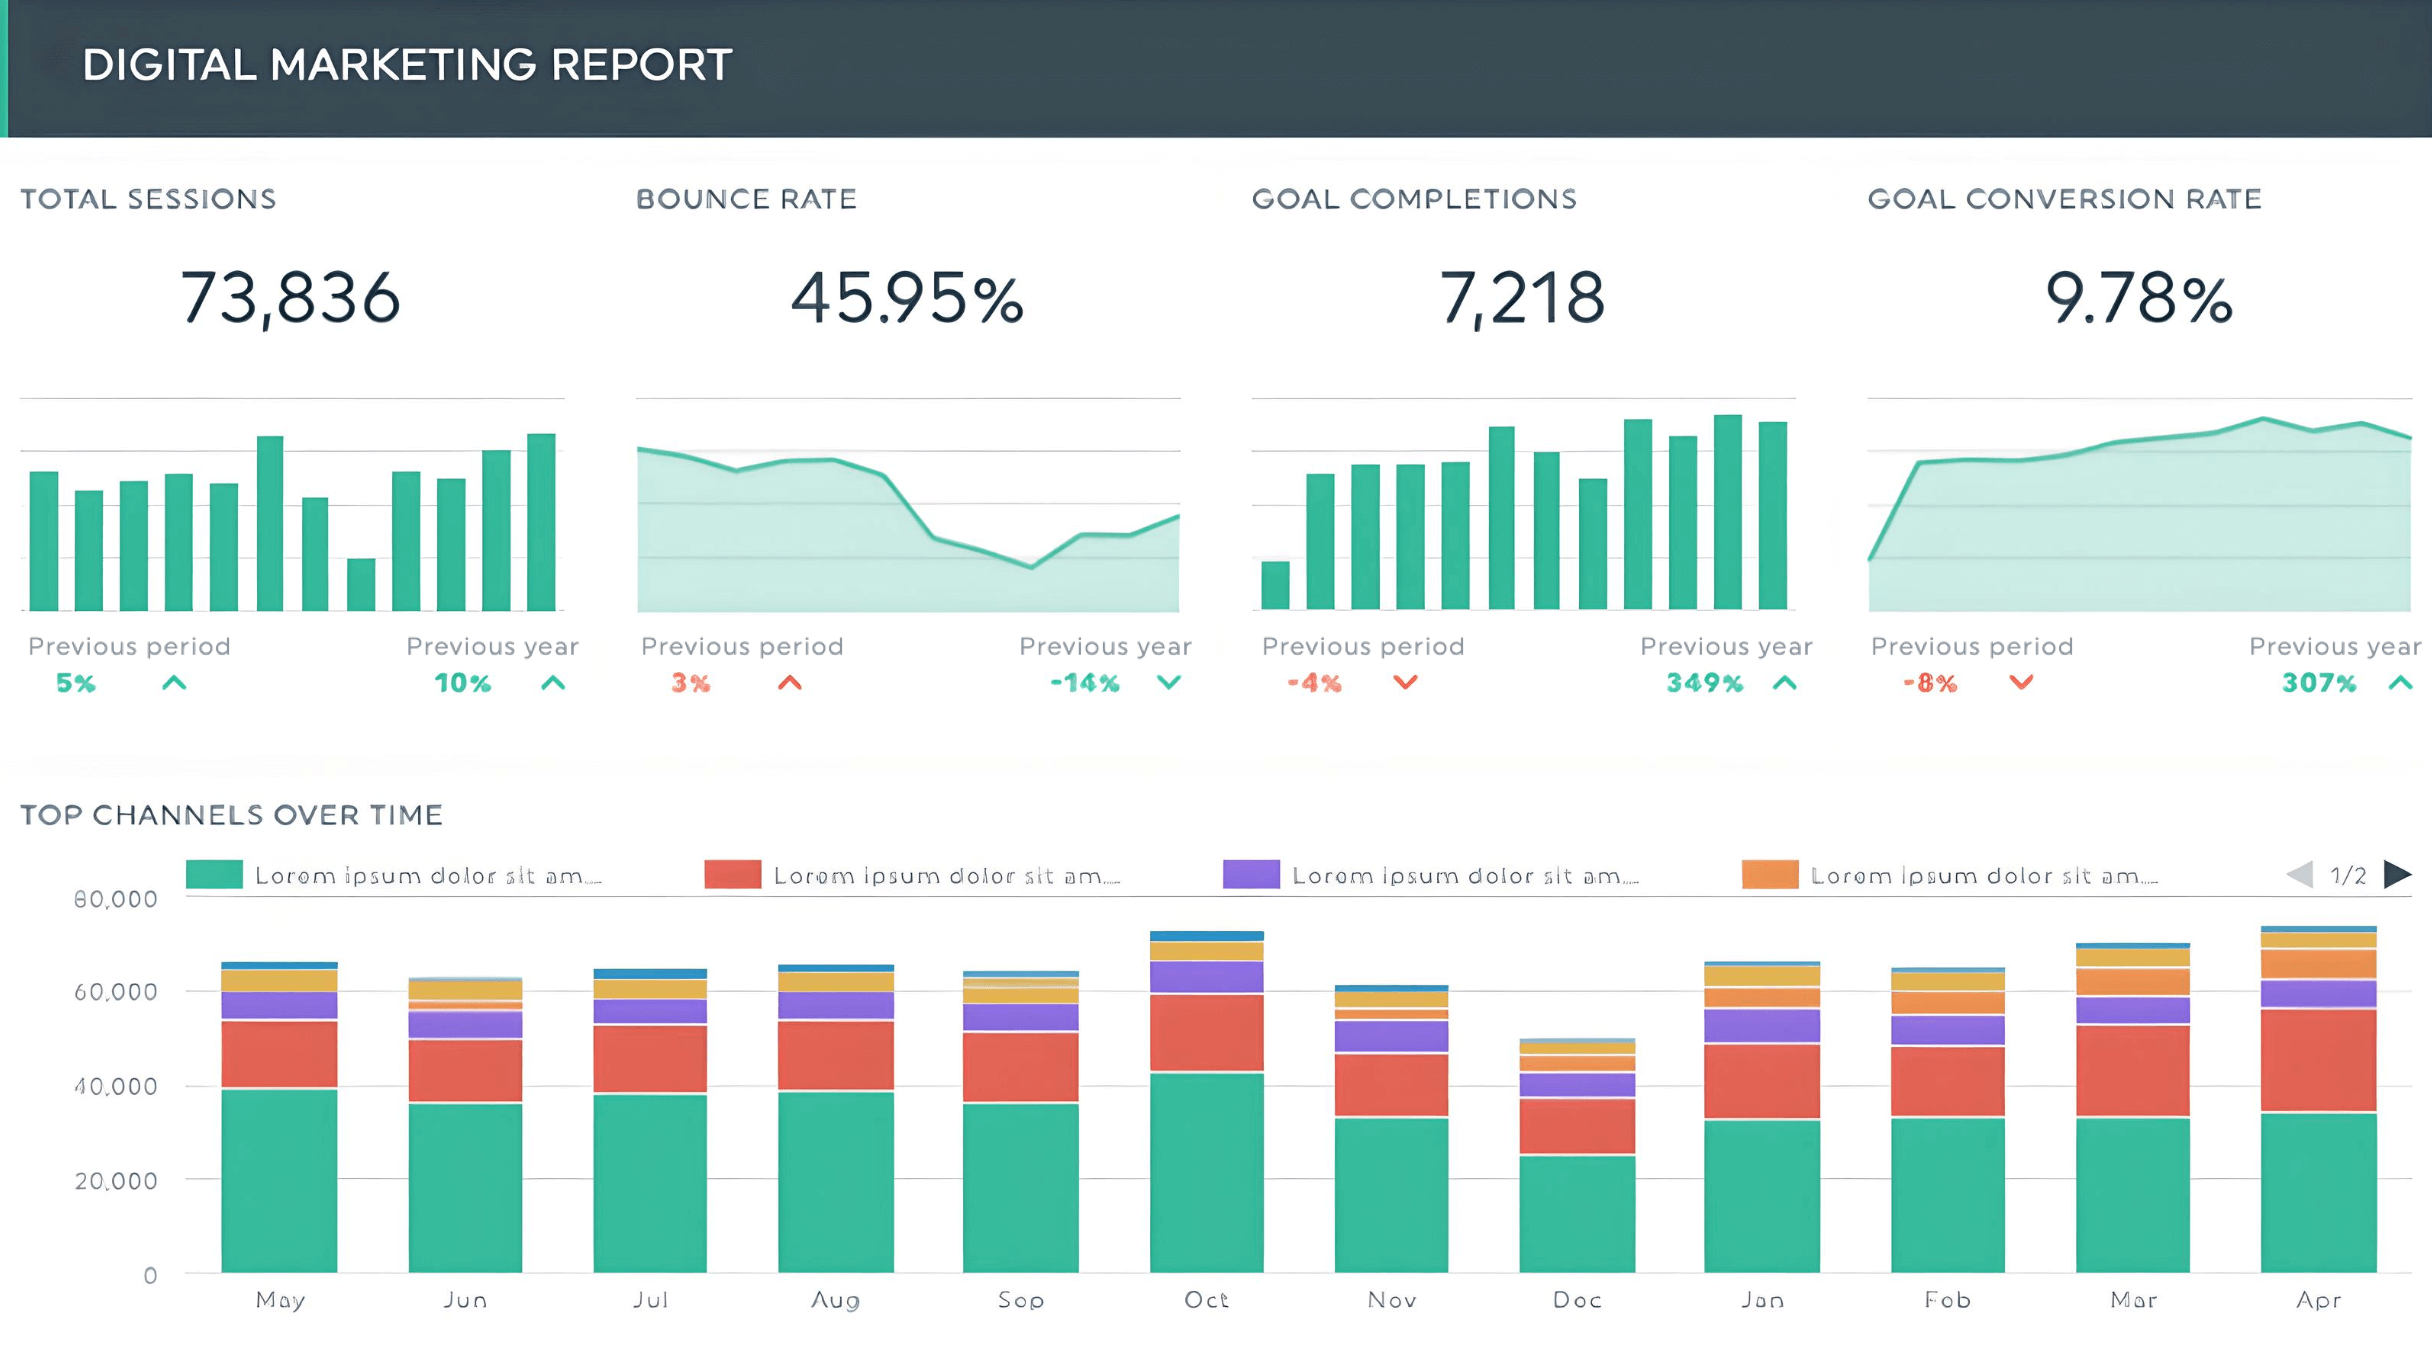
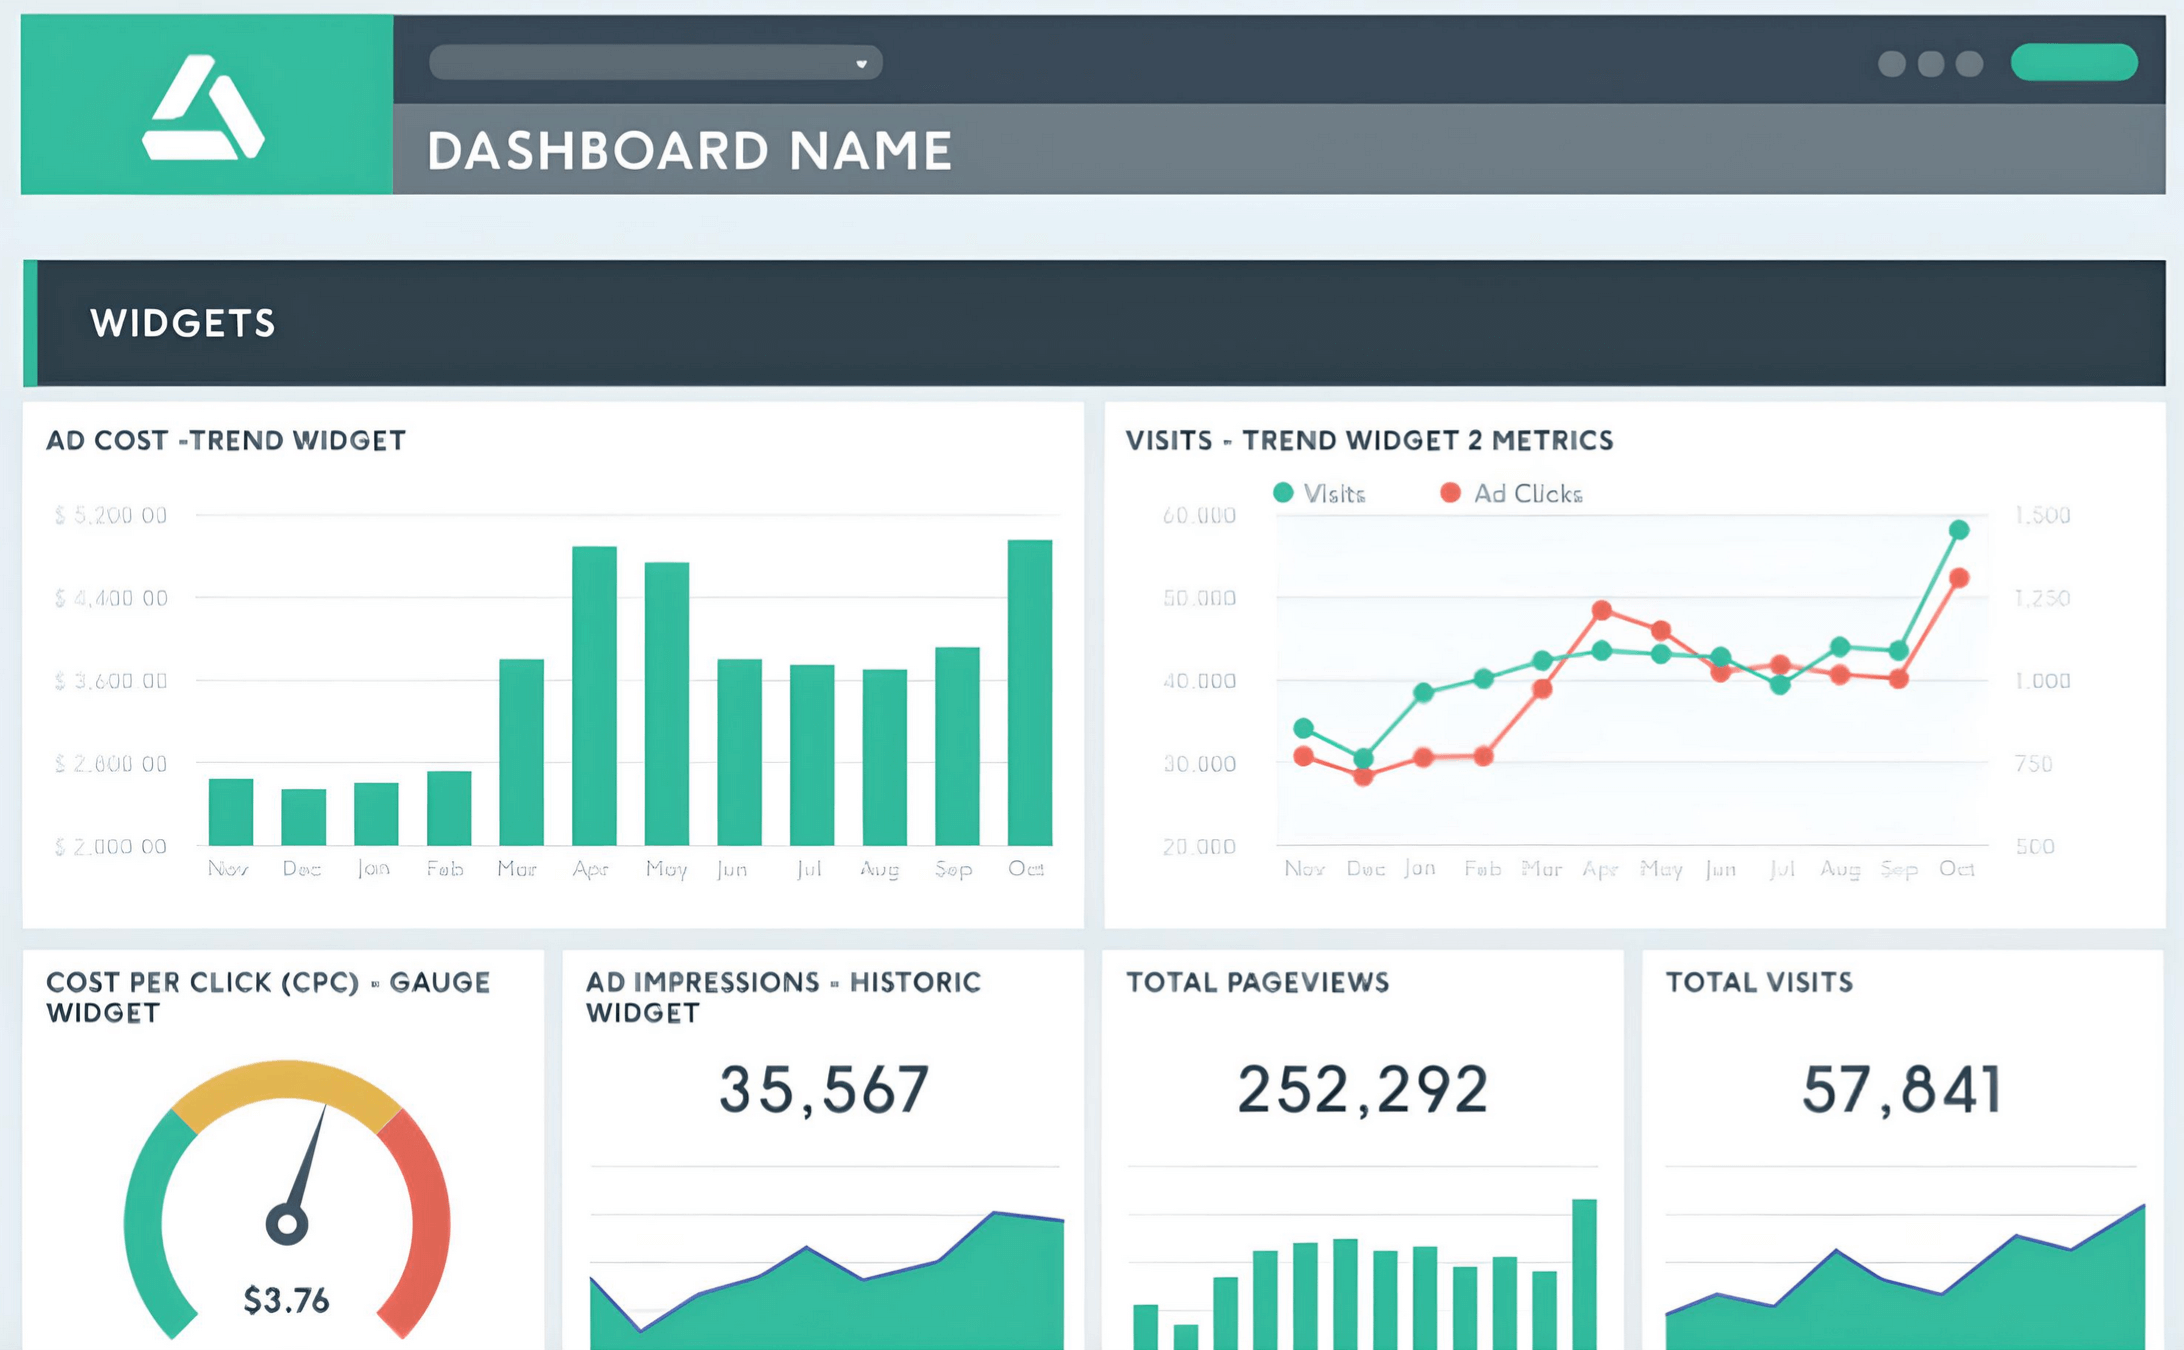
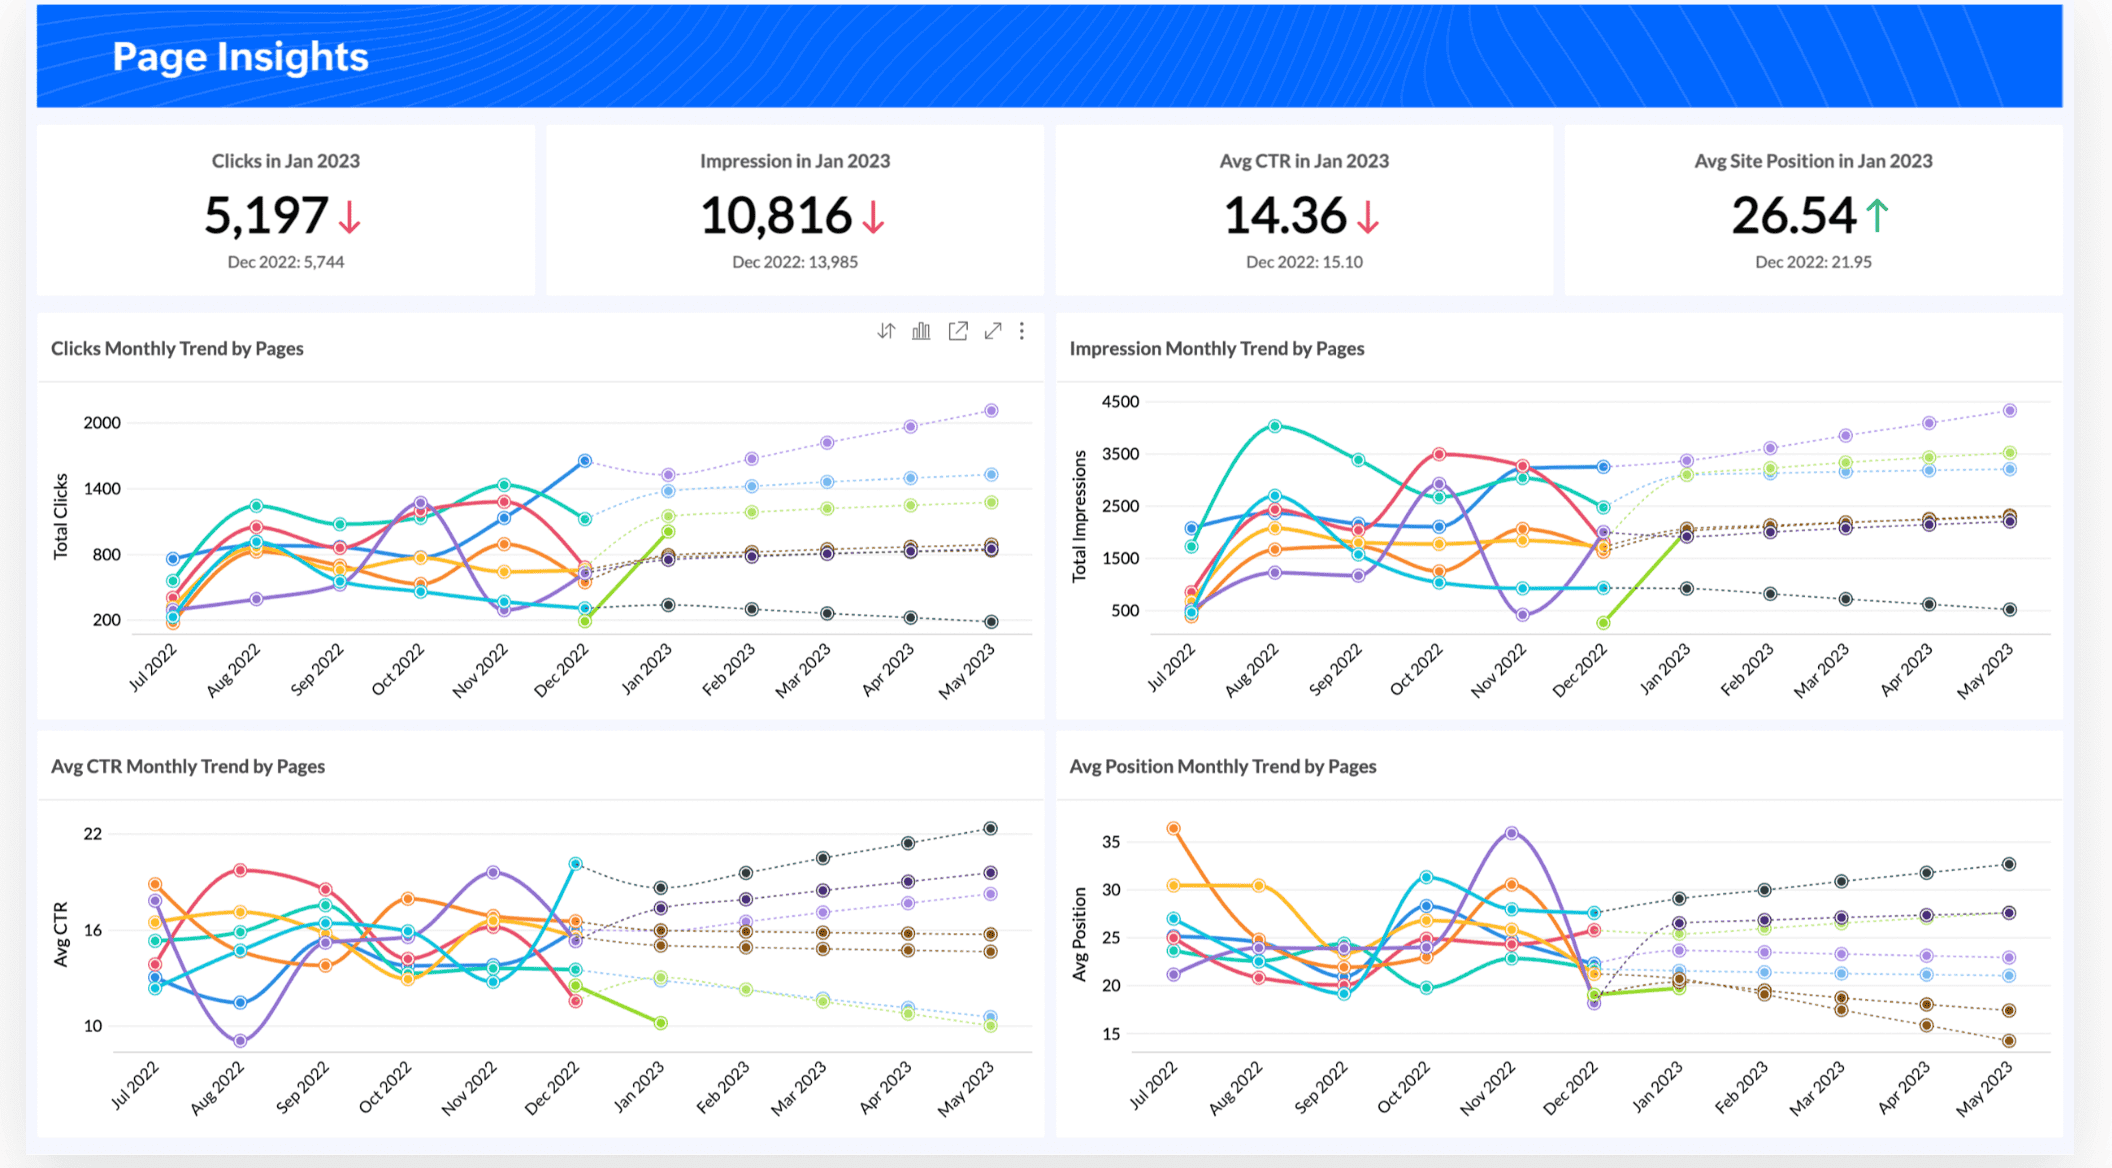
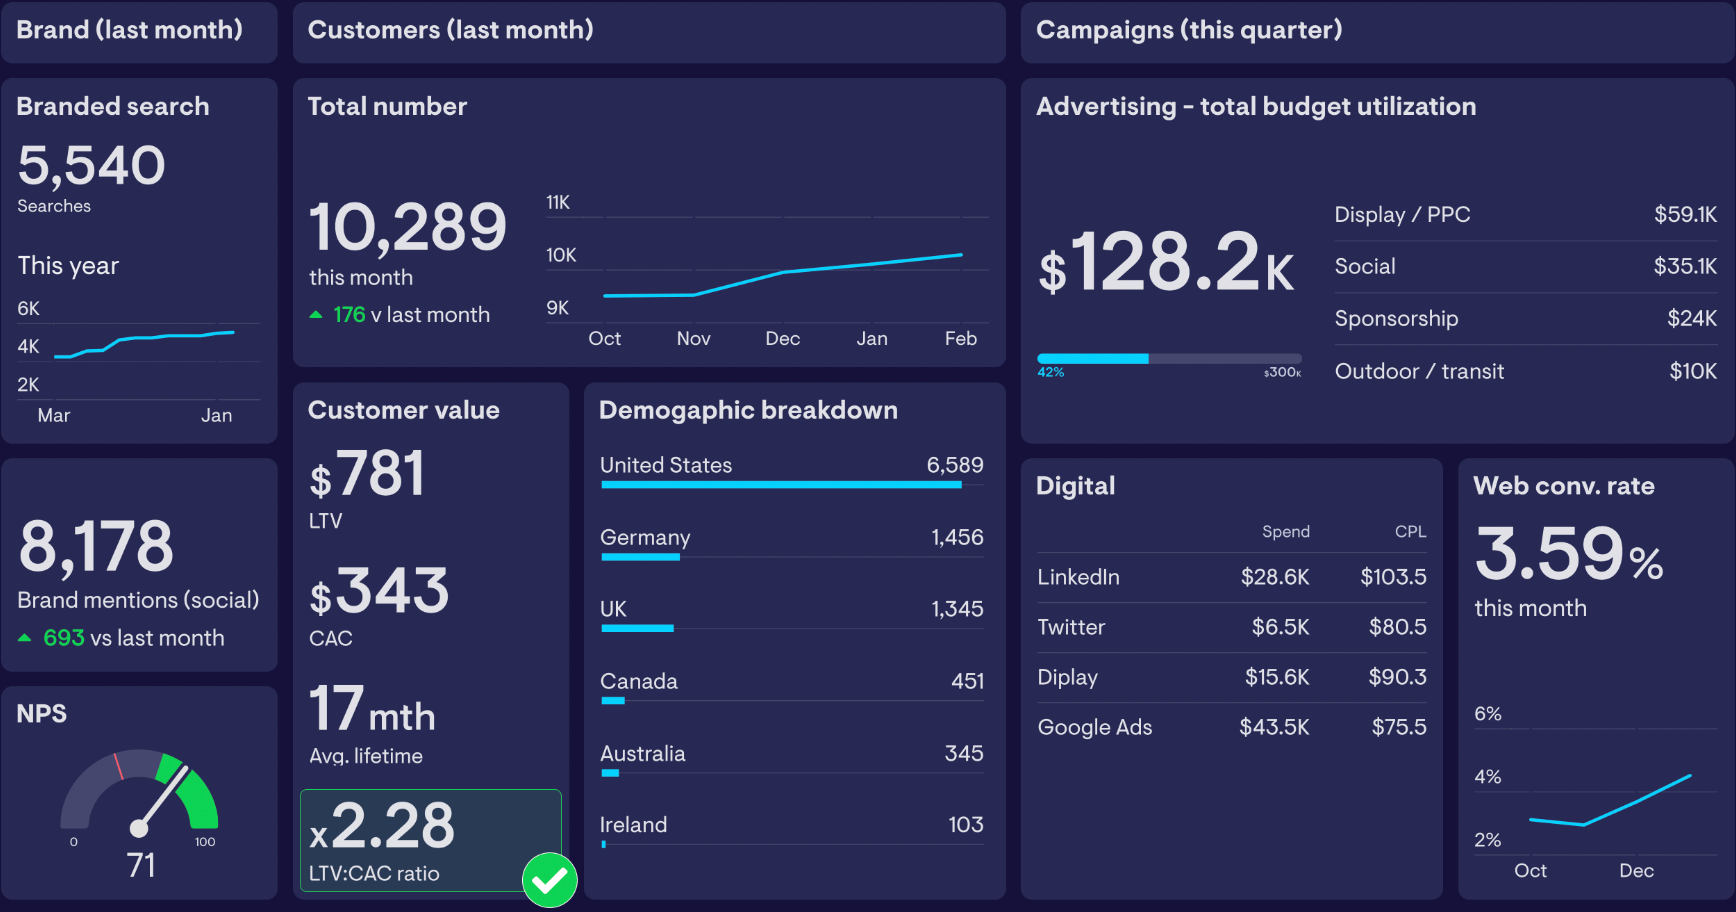
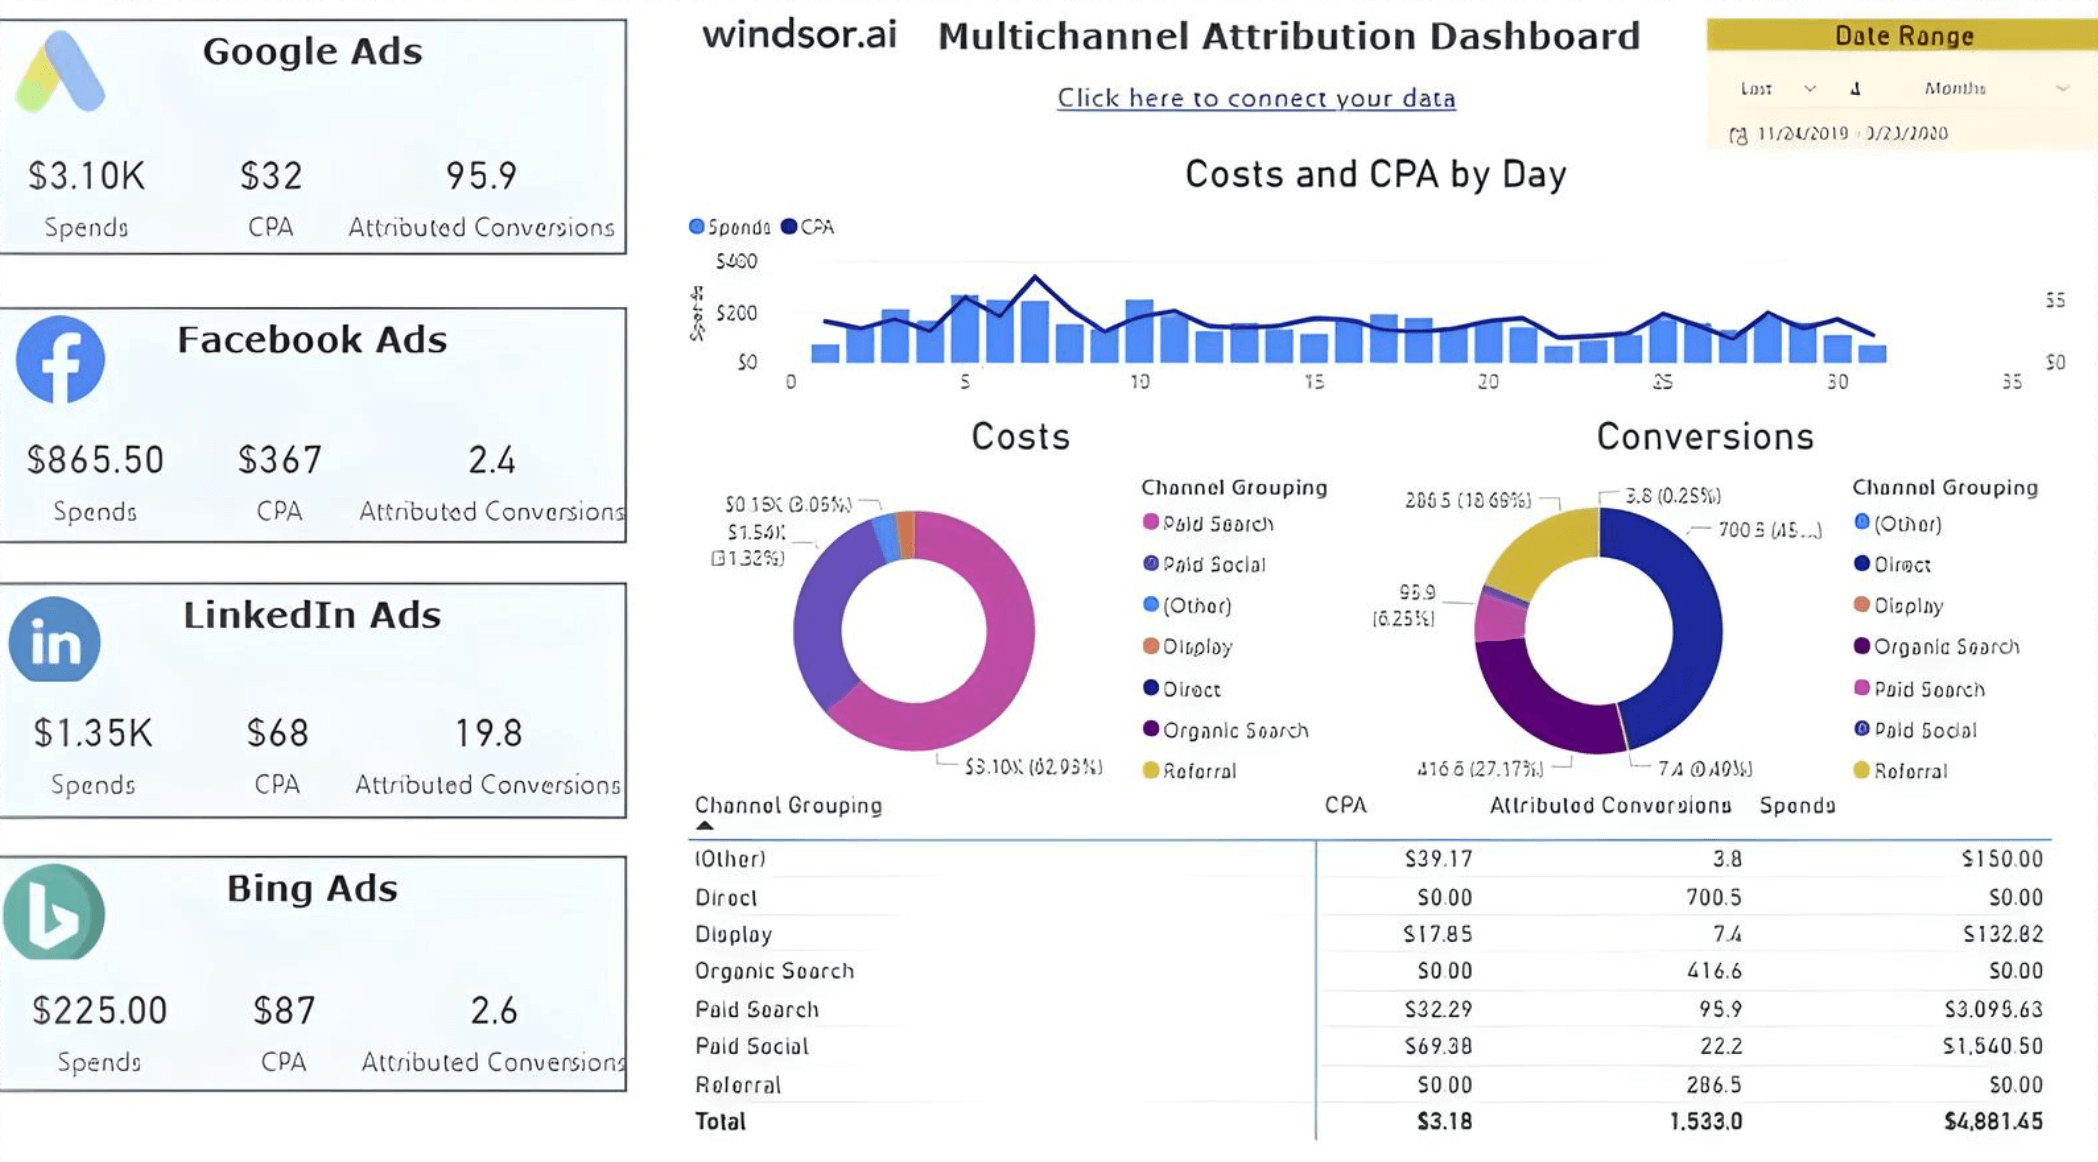
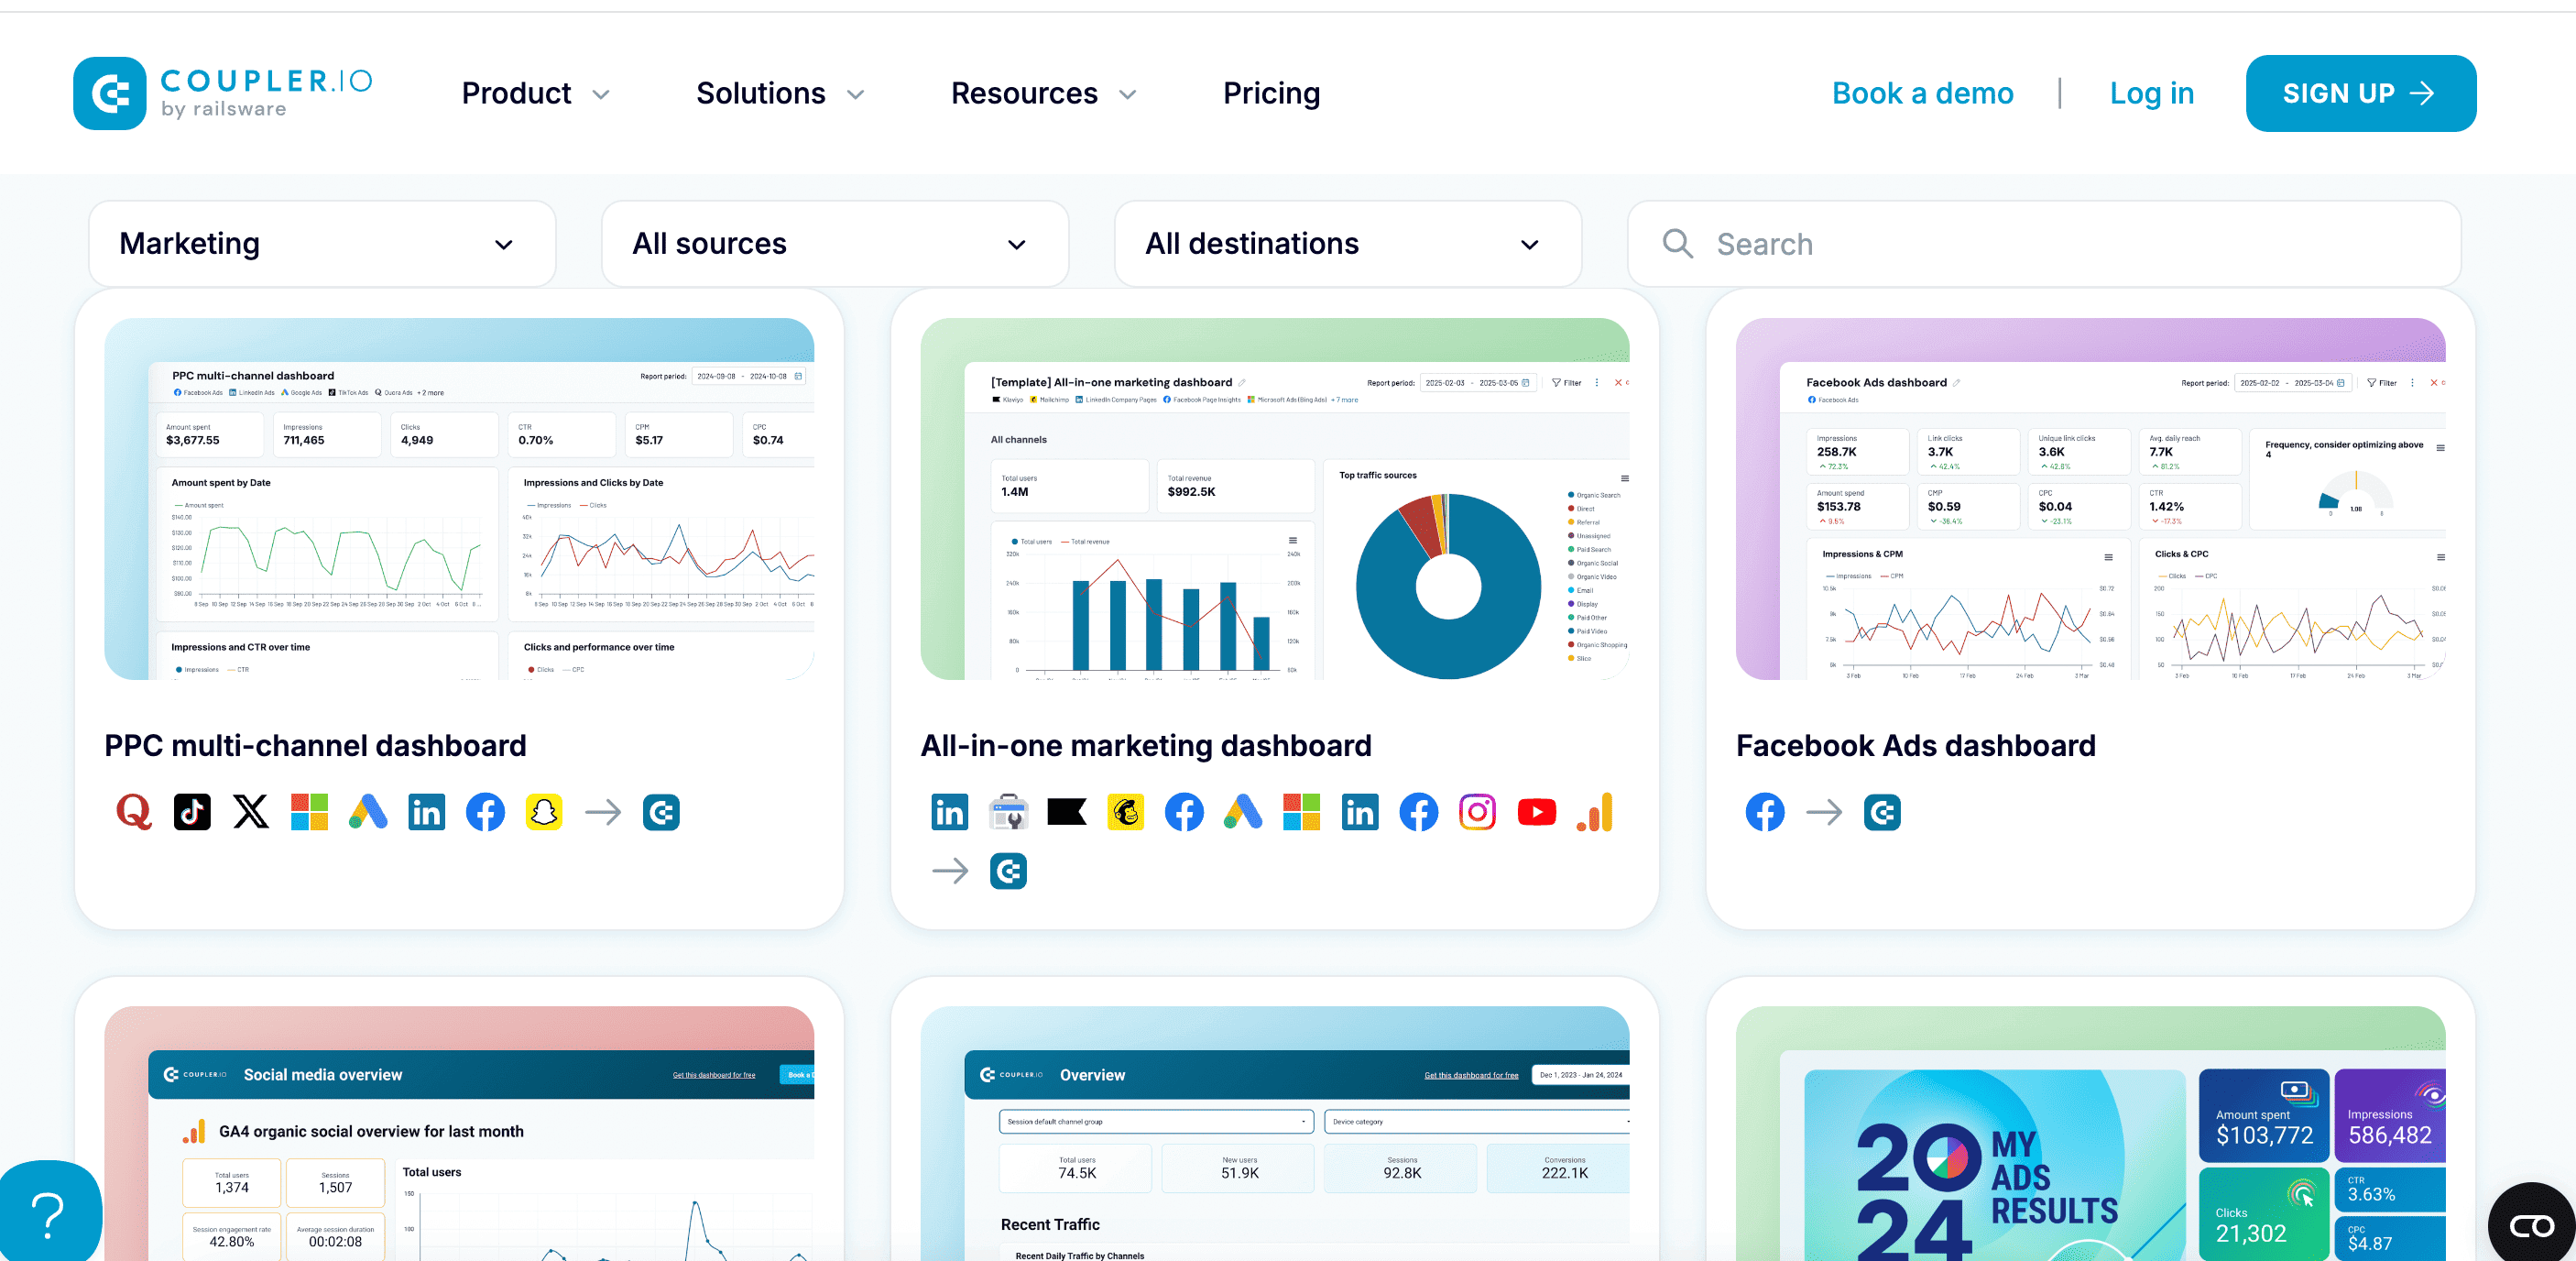
A marketing dashboard is a tool that helps you see your necessary marketing data and results in one place. Dashboards present everything side by side, which means you don’t need to jump between different platforms to check your email stats, website traffic, or social media KPIs. Think of it like a control panel for your marketing results.
Dashboards are usually visual, with charts, graphs, and numbers that update in real time. With a dashboard, you gain a deeper understanding of what in your strategy is working, what isn’t, and where you might need to make changes. Whether you’re tracking a single campaign or your whole marketing strategy, using dashboards will help you stay on top of your objectives.
Who uses marketing dashboards?
Marketing dashboards are helpful for anyone involved in planning, executing, or analyzing campaigns. This includes:
- CMOs (chief marketing officers): to get a high-level view of performance across all channels.
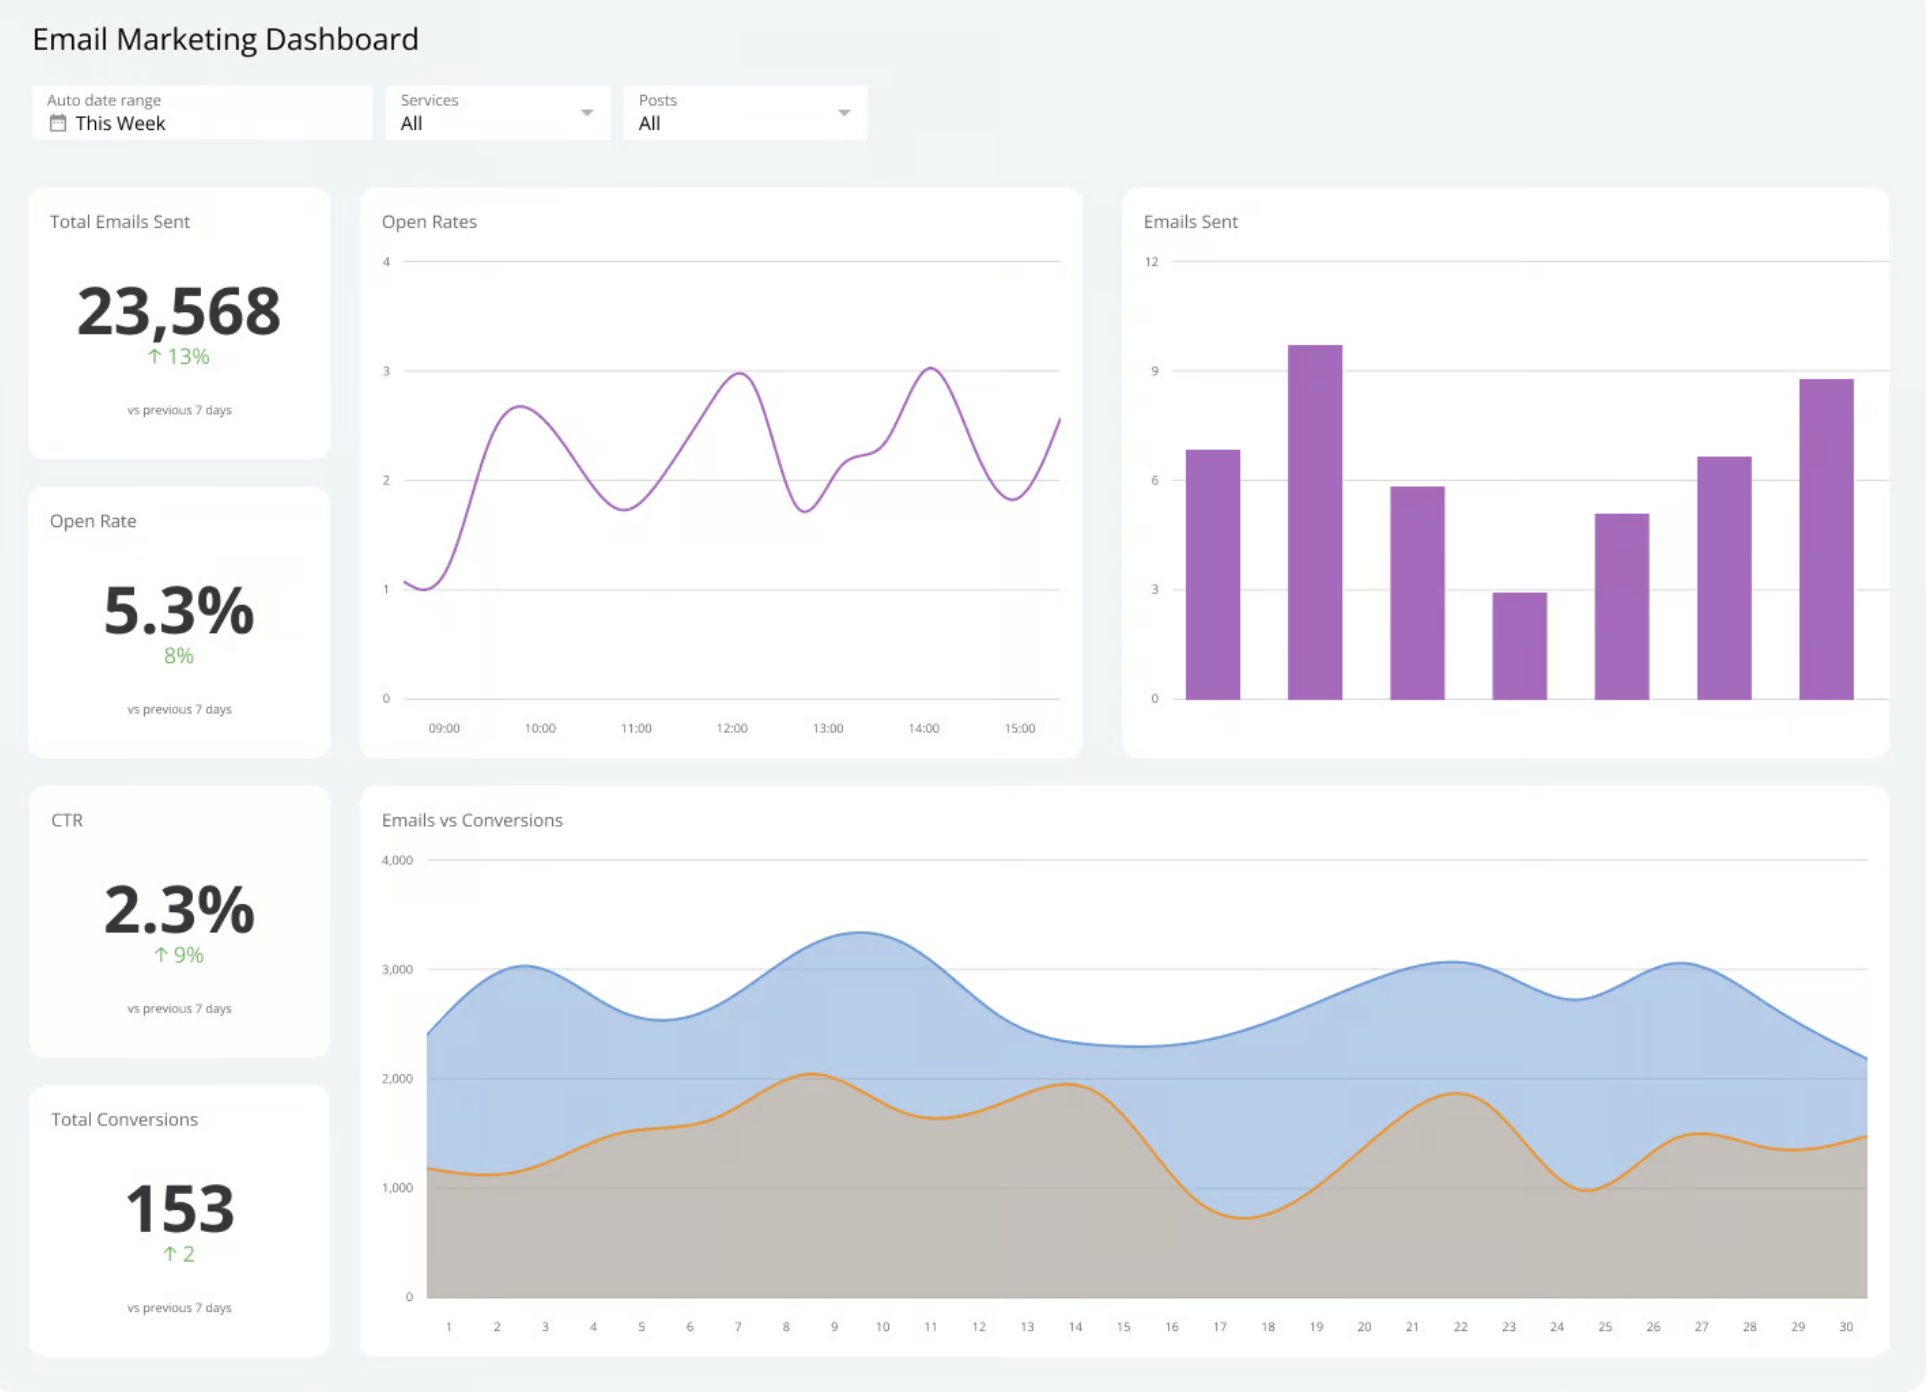
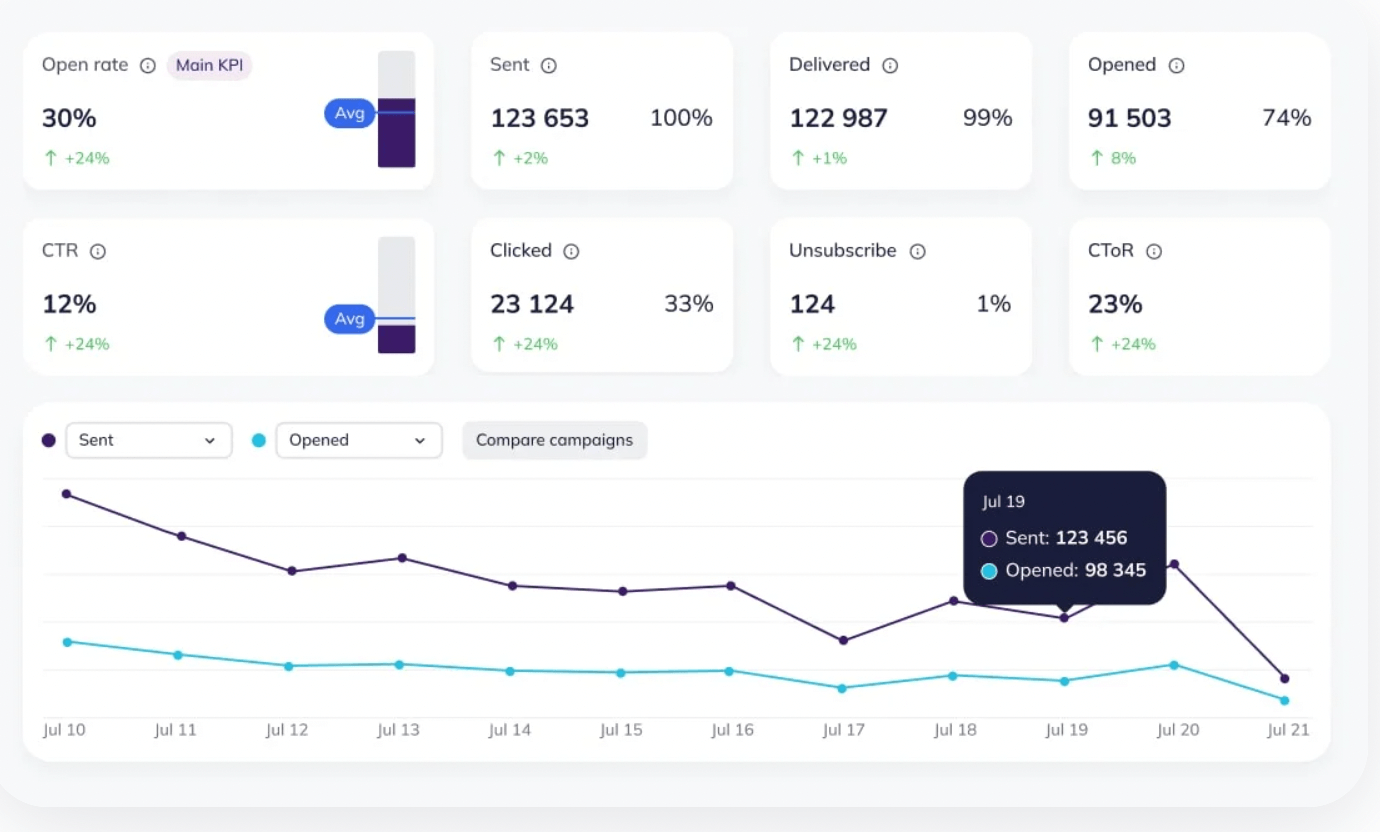
- Email marketers: to follow open rates, clicks, and other email KPIs.
- Marketing analysts: to understand detailed metrics and trends.
- Social media managers: to monitor campaign reach and engagement.
- Digital marketing managers: to track website traffic and conversions.
Top metrics to track on your marketing dashboards and reports
Your marketing dashboard is only as useful as the data you include. However, not all metrics are going to be relevant to every marketing professional, and not every business has a full marketing team to handle each area separately. If you’re just starting out, one person might need to wear several hats — for example, being responsible for email as well as social media marketing.
We’ve compiled a table for you to understand what metrics matter the most, and for whom they’re typically useful — whether it’s one person or a whole team.
| Metric | What it measures | Who it’s for |
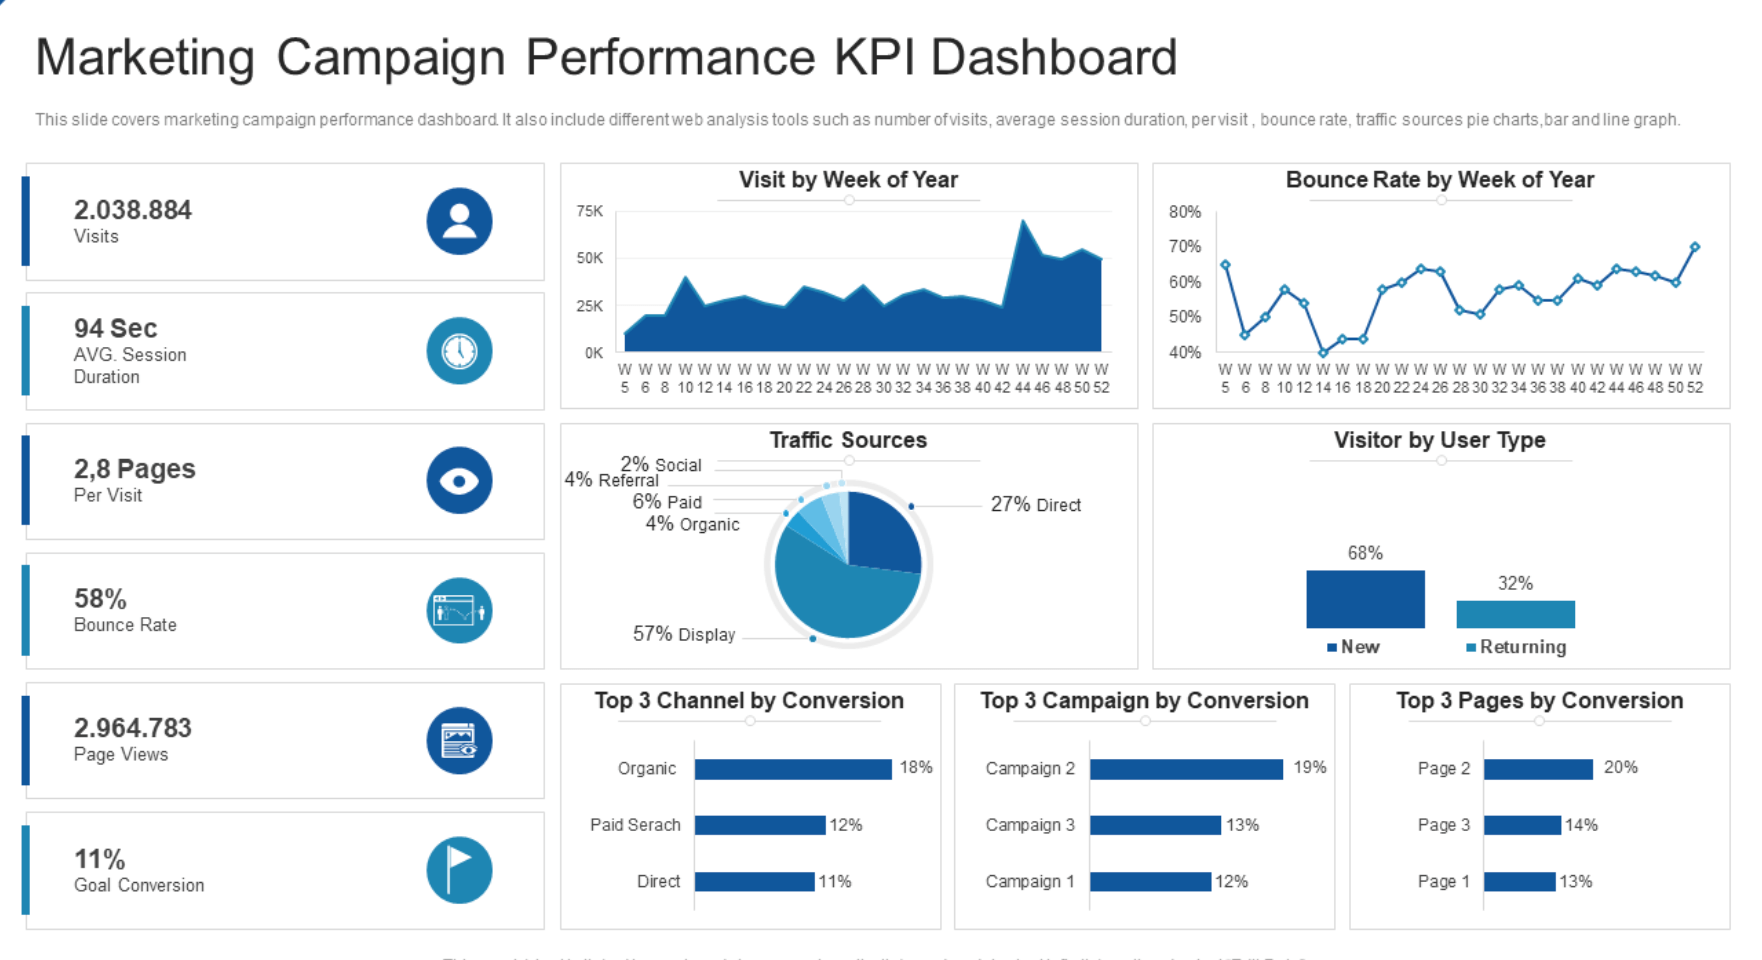
| Website traffic | Number of visits, page views, time spent | Marketing analysts, digital marketing teams |
| Traffic sources | Where the visitors are coming from (search results, ads, etc.) | SEO specialists, digital marketing teams |
| Conversion rates | Percentage of visitors who complete a desired action | Campaign managers, analysts, CMOs |
| Email performance | Email clicks, bounces, unsubscribe rate, etc | Email marketers |
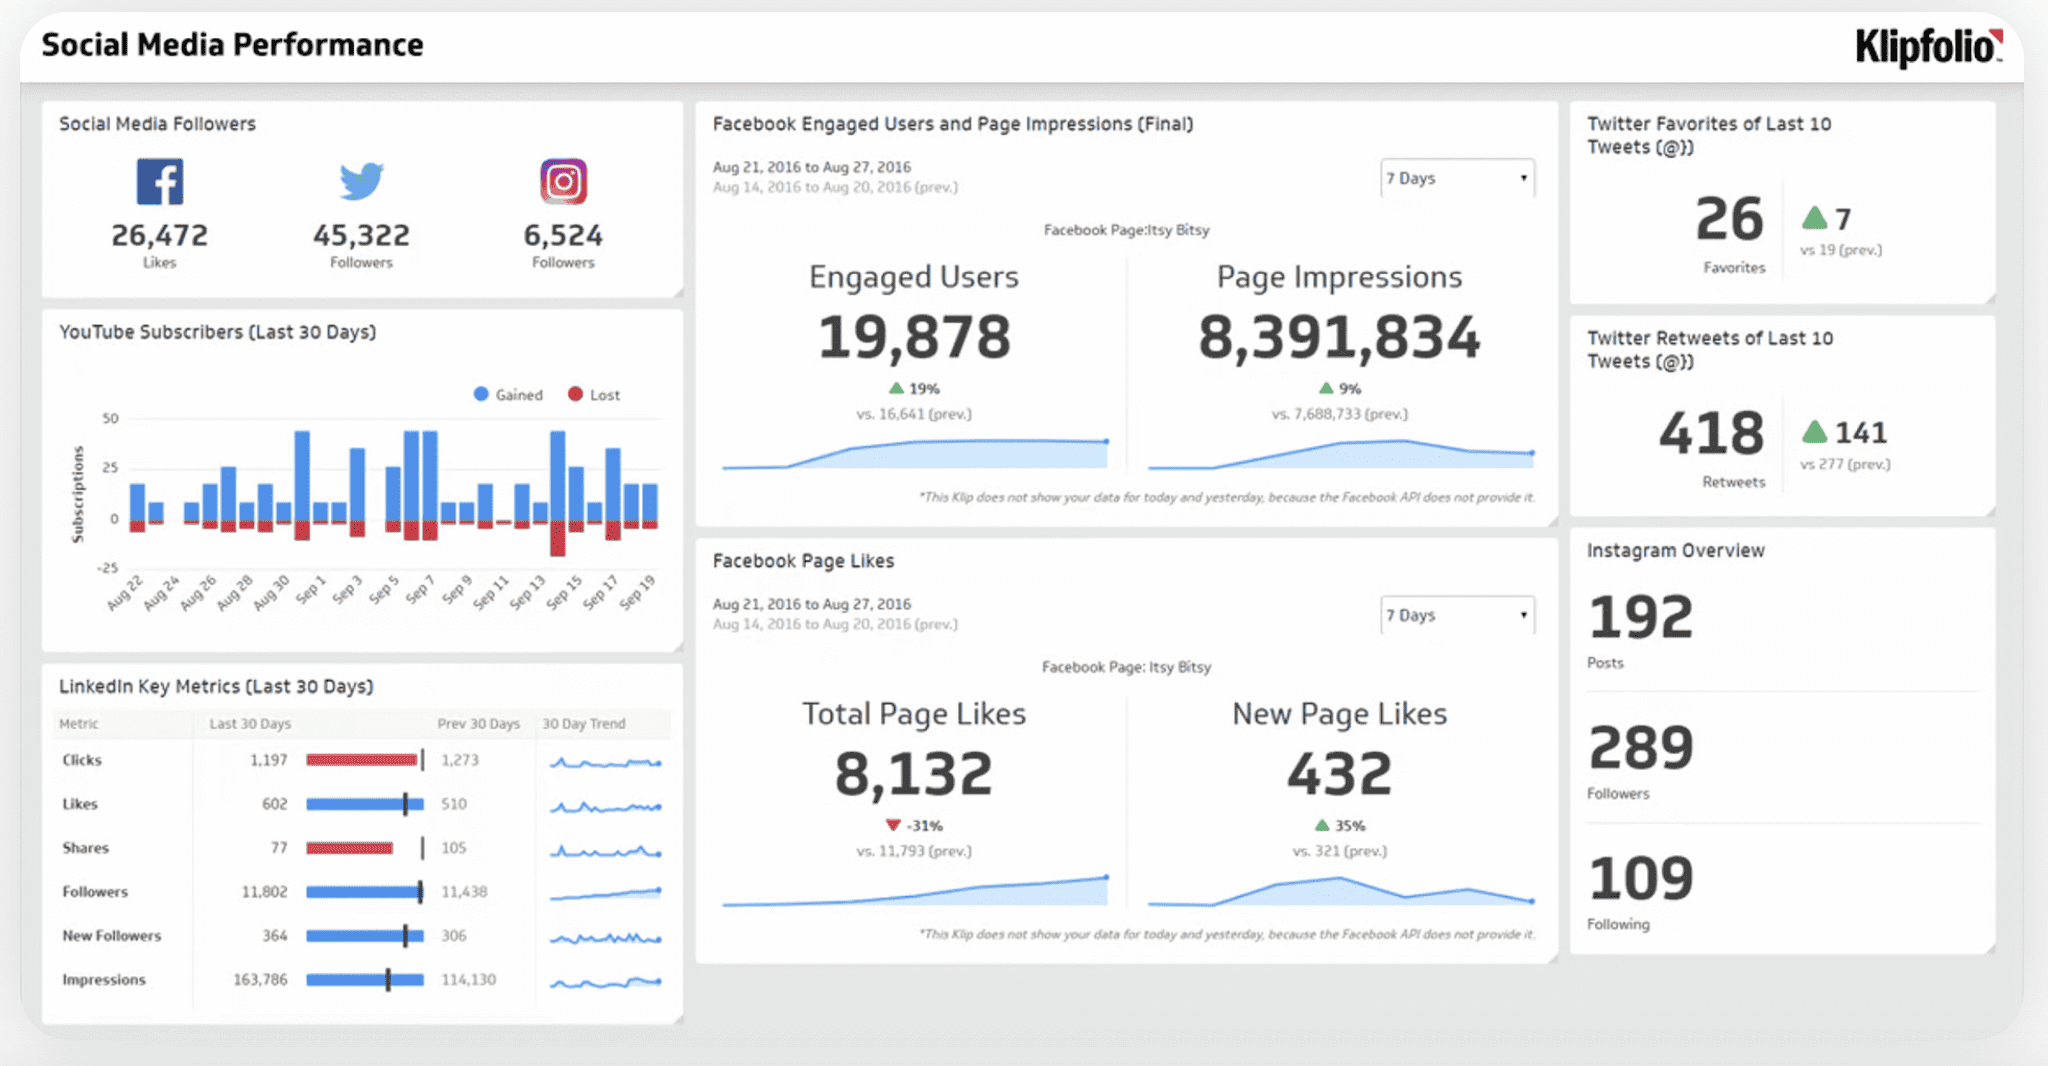
| Social media engagement | Likes, shares, comments, follows | Social media managers |
| Lead generation | How many leads and lead conversions you generate | Marketing, sales teams |
| Ad performance | Impressions, clicks, return on ad spend | Ad teams, digital marketers |
| Search performance | Keyword ranking, organic sessions | SEO and content teams |
| Customer acquisition | Number of new customers acquired | Growth and acquisition teams |
| Goal tracking | Progress towards set KPIs | Everyone |