Email analytics is the analysis of various indicators related to email marketing campaigns.
Launching an email campaign and sending emails to customers looks like a simple task. But if you consider email marketing beyond just mechanics, but as a way to communicate with a client, it becomes more complicated.
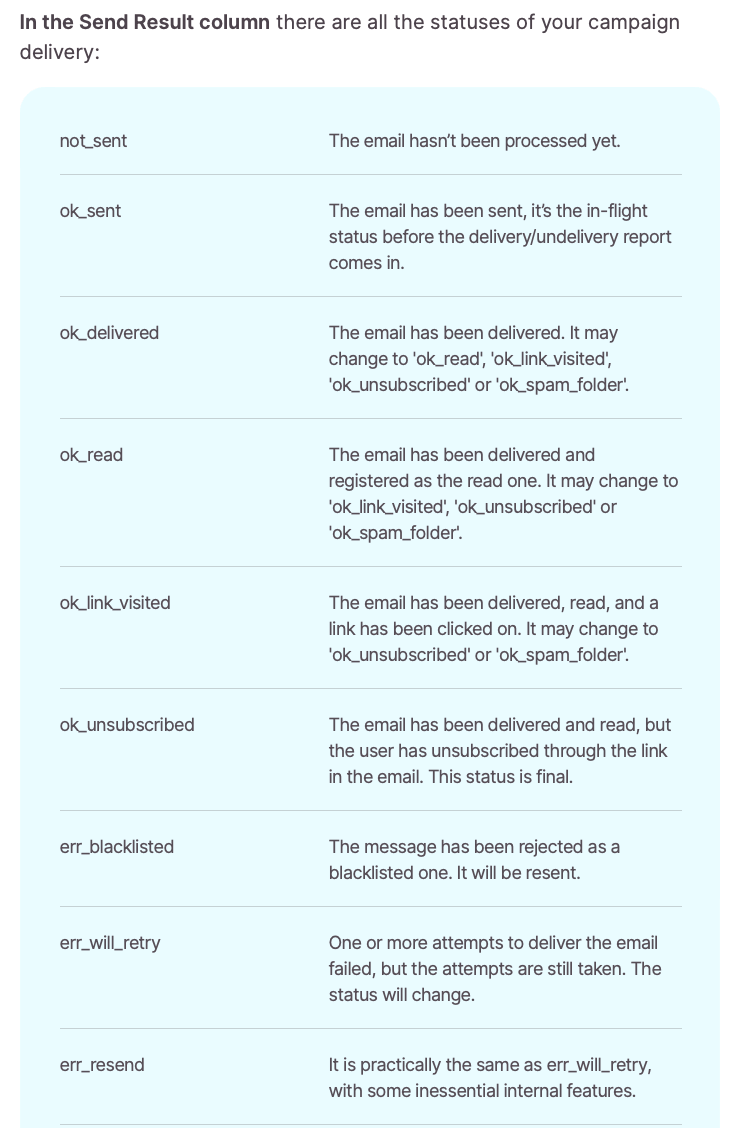
A lot happens during the email marketing process until the emails actually reach the recipient and every step needs to be assessed and evaluated. So email analytics, in other words, is monitoring data related to sending and interacting with emails on each step of the process.
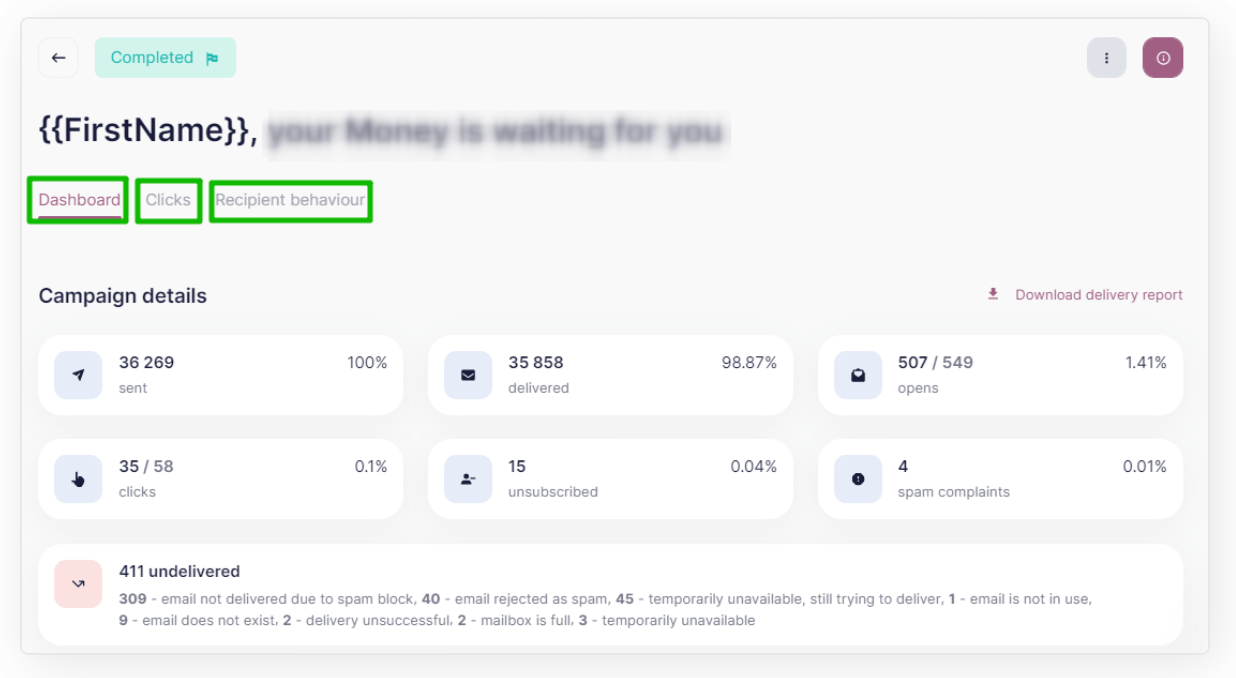
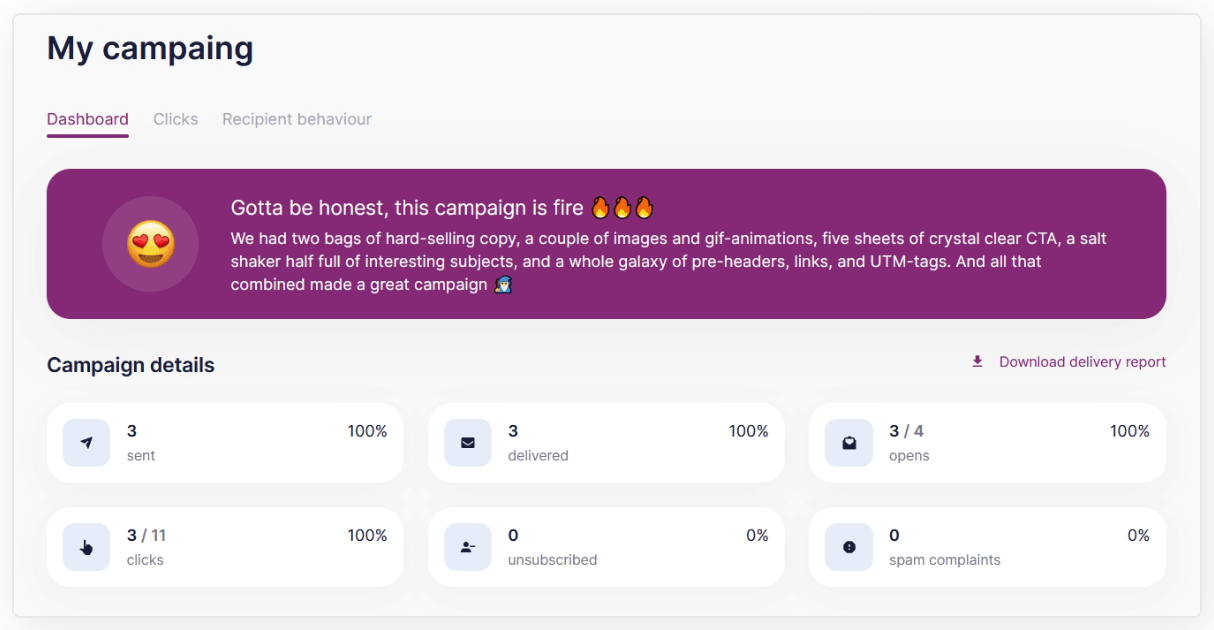
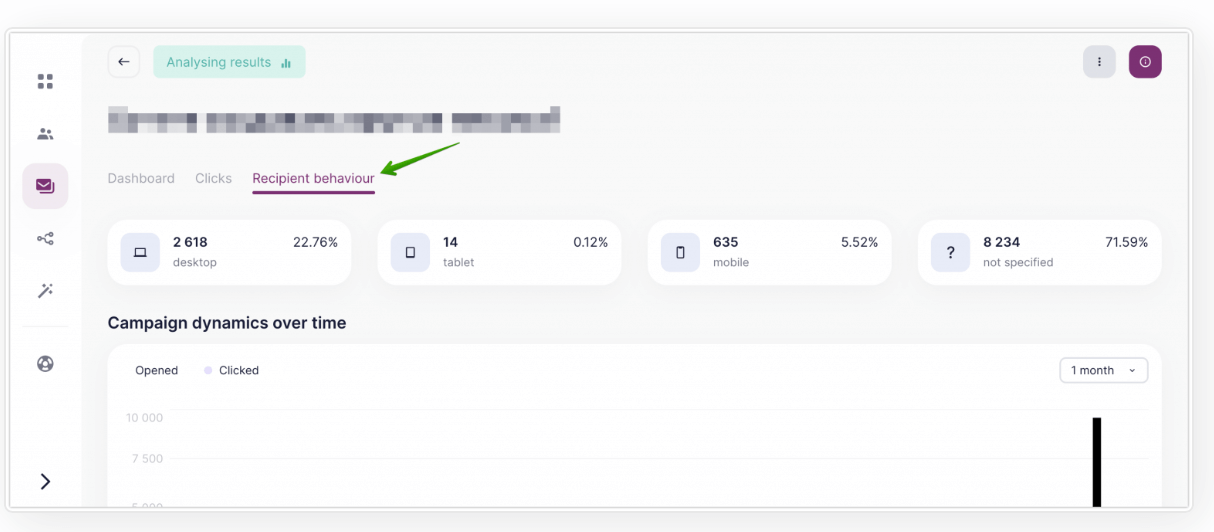
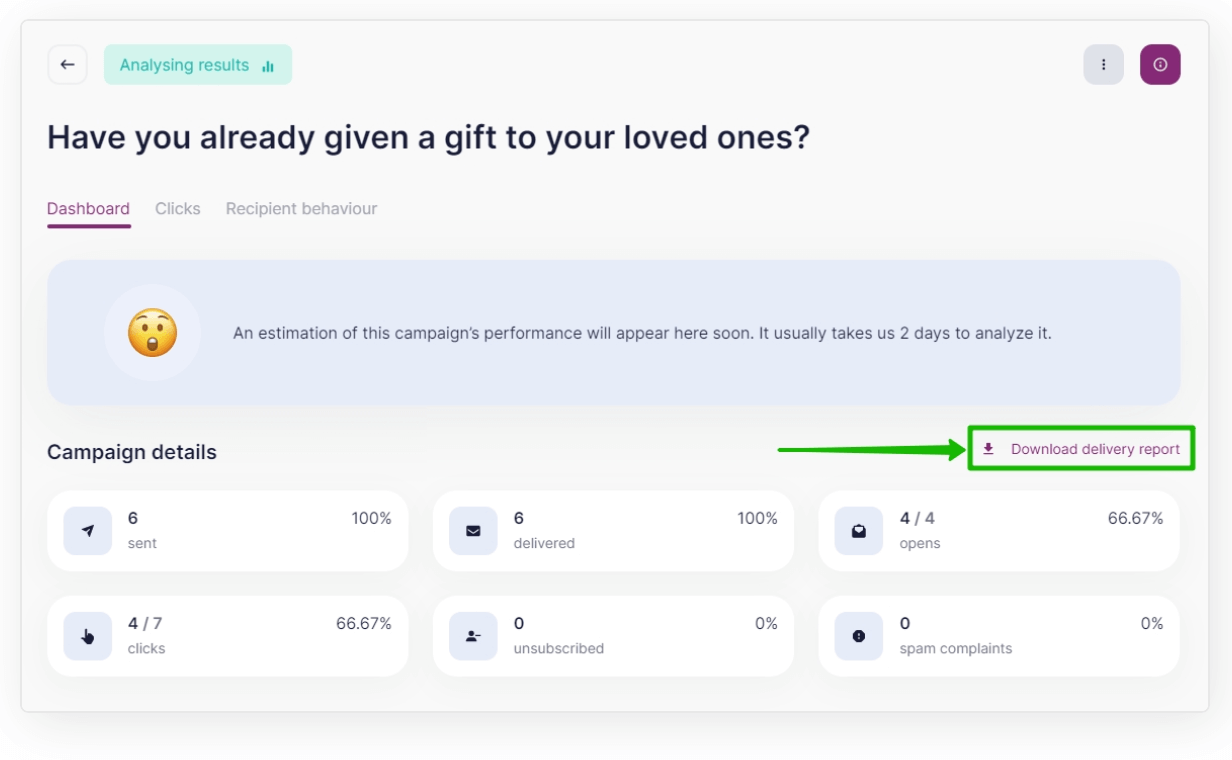
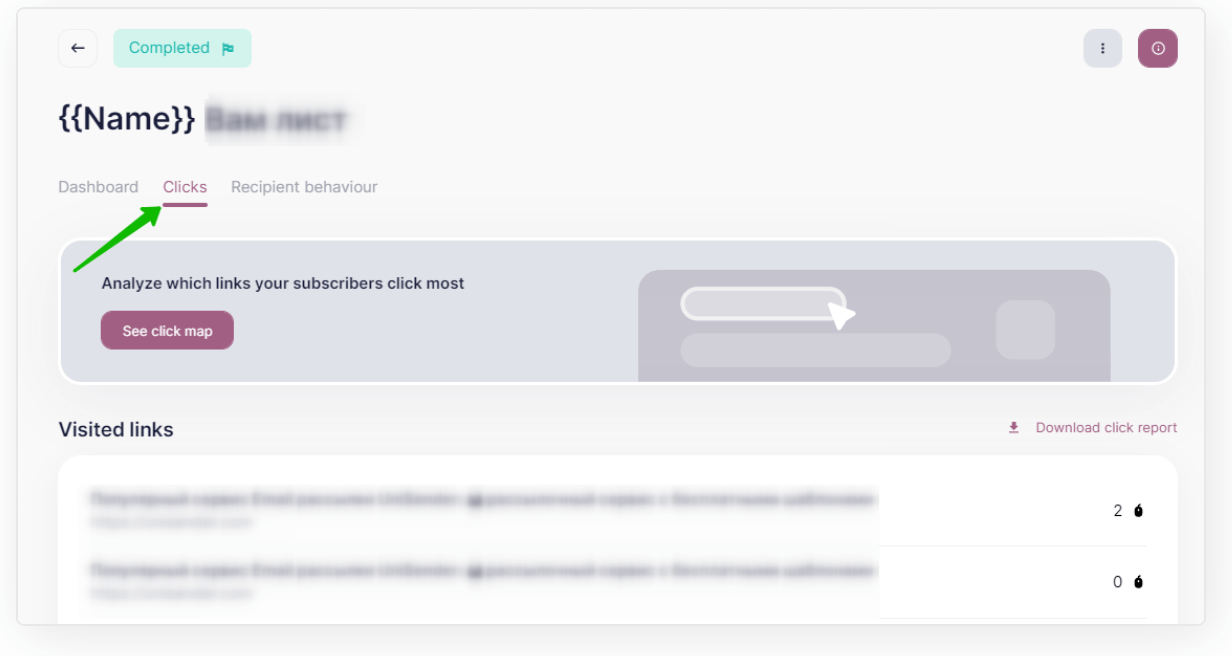
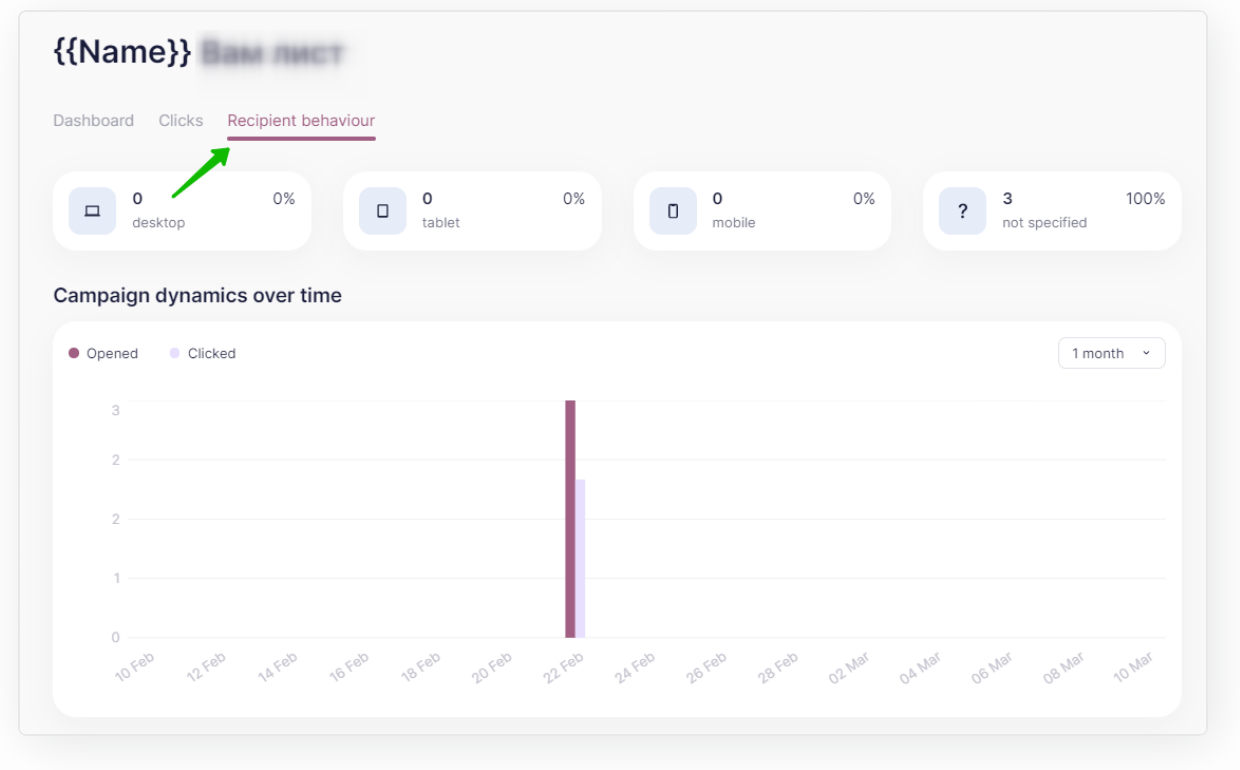
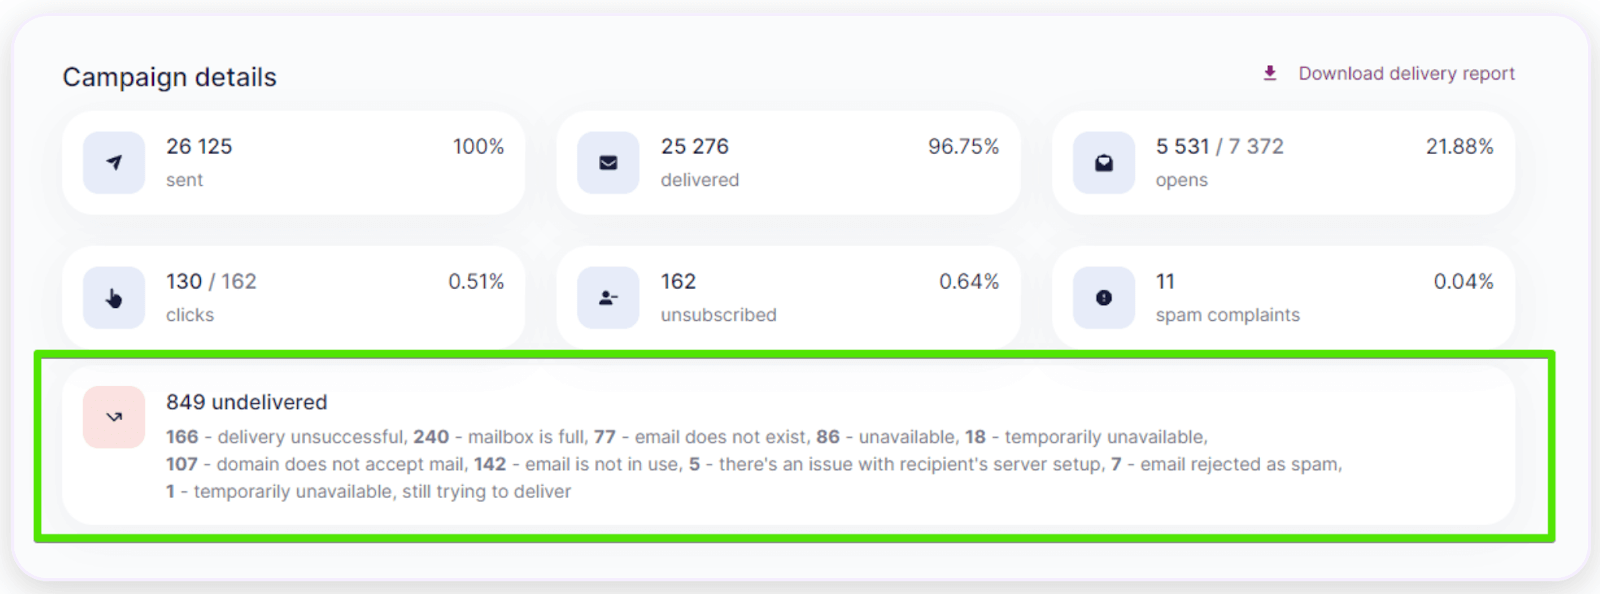
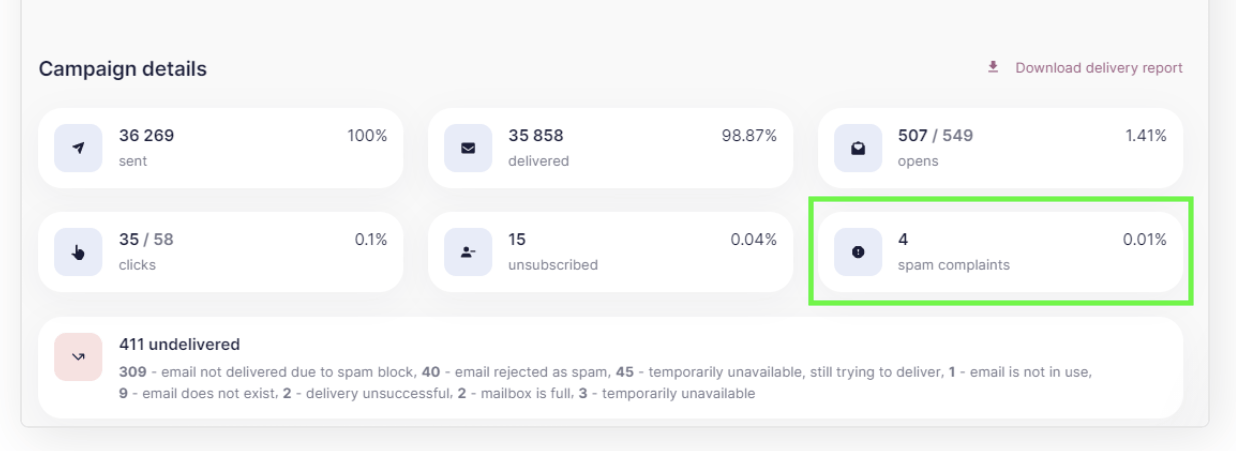
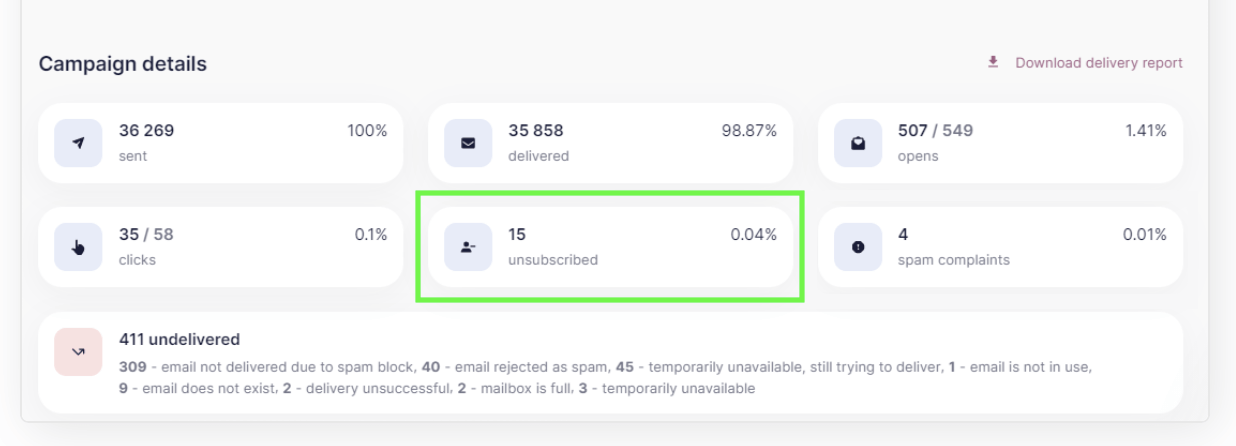
Based on various metrics, it helps businesses understand how many people have opened an email, how many times they have clicked on links and, most importantly, whether it has brought any sales. Analytics also provides a deeper insight about the preferences of your audience, the activity and behavior of your subscribers on the website.
Let’s take a deeper look on why businesses need email analytics in modern marketing.
Regardless of the type, every business strives for similar goals – to maximize the effectiveness of its marketing efforts, retain the attention of loyal customers, and attract new ones. Email analysis can help with all of that.
To develop trusting relationships with their clients, companies need to set the right email marketing strategy, and then optimize it. It means that to make an email marketing campaign effective, businesses need to actually know what their customers want.
Email analytics provide the answers to this question and allow businesses to learn more about their subscribers’ behavior and preferences. Data collected by email analytics describes which type of content their customers react to, what they like or not and more.
If the results are positive, it can help businesses to make sure that they are on the right track. By maintaining the same strategy they could attract even more new customers.
If the business is not satisfied with the results of its email campaign, it can try new strategies, test different types of campaigns, or other hypotheses to achieve better results from their email marketing efforts.
Deliver your mail to the right place
Delivery performance indicators are important, with their help, you can make sure that your emails actually get into the mailboxes of your subscribers.
If you track delivery performance, you’ll see that email addresses that you’ve sent a message to can have different statuses. Below there are examples of such statuses, showing exactly what may happen to the emails you send. Perform email analytics to avoid system rejections, and minimize bounces.
After you have made sure that your emails reach the recipients, you can start analyzing content performance of your email campaign.
Learn what your audience does with your emails
Email analytics allows companies to track metrics such as the number of opens, clicks and conversions, as well as unsubscriptions or the percentage of messages sent to spam. These metrics give you an idea of how the subscribers respond to your emails.
Segment your audience
Analytics helps you divide your audience into smaller target groups based on geographic or digital behavior for better email segmentation.
Let’s suppose that the majority of your clients read emails from desktops, a solid number of them open emails on mobile devices, and only a few people use tablets. Based on that you can vary and adapt your content for the digital behavior of your customers.
Optimize your campaign
Based on the results of your A/B tests or your previous email campaigns, you can further experiment with various elements of your emails (templates, visual content, surveys, calls to action, etc.), to optimize your campaigns and achieve maximum impact.
Measure profits and reduce costs
The success of your email marketing efforts depends on the return on investment (ROI). With the help of analytics, you can evaluate the effectiveness of your strategy and identify areas for improvement, simply by tracking the revenue generated from your email campaigns and comparing them with costs.
Email analytics is a collection of different metrics that you need to monitor if you want to get the most out of your campaign. We have selected the 10 most important and necessary indicators for you to track:
Email deliverability is one of the most common metrics that indicates how many emails reach subscribers’ inboxes and do not get lost along the way or marked as spam.
The average deliverability rate is 88.9% of the number of incoming messages while 11.1% of emails bounce or are intercepted by spam filters.
What may affect the quality of email deliverability? First of all, anti-spam filters are set by the email services. Due to the fact that 45% of the world’s mail traffic is spam, mail services put extra effort into filtering suspicious messages out which can sometimes affect even legitimate mailings.
However, the principles by which these services sort emails for spam differ, so your email campaign may be spam filtered, for example, by Google, but not by Yahoo. Also, your subscribers can mark your emails as spam, and it will also be reflected in your email deliverability rating.
This rating is affected not only by spam, but also by system bounces, caused by such reasons as outdated email addresses, or full recipient’s mailbox. A high bounce rate can lead to the sender’s domain or IP address being marked as suspicious too.
The open rate metric measures the percentage of recipients who not only got your email delivered in their inboxes, but opened it.
One email can be opened once, or a few times. For example, 10 emails were delivered, 7 people opened them, 3 people opened the same email more than once.
Based on that, there are two different types of and open rate metric:
Of course, it is almost impossible to predict in advance whether a user will open your email or not, or how many times. Good news – you can work on that.
Based on the email’s performance, you can estimate how well its subject line has worked as this is one of the few things that the recipient sees before opening an email. So, if you have a low open rate, work on the subject of the email to attract subscribers’ attention and encourage them to view your emails.
Based on the Statista report, in 2023, 57.8% of marketers from around the world reported that their open rates ranged from 20% to 50%.
So 20% open rate can be already considered as good. However, open rates often depend on the industry.
Open rate becomes less significant in modern email marketing because of mail privacy features. Plus, even if somebody opens your email, it does not mean that they actually read it or interact with it. Then how to make sure that email campaign is effective? By analyzing clicks!
The email click-through rate (CTR) shows a number of clicks compared to the number of emails delivered. When somebody clicks on a hyperlink or advertisement inside an email, it means that they acted upon your message. This indicator is used in digital marketing to measure the level of user engagement. Users can click through different tools. For example, on an advertising banner or an image, a call-to-action button, a hyperlink, etc.
So if 100 mails were delivered, 50 of them were opened, and 5 people clicked on links, CTR is 5 out of 100, or 5%.
A high click-through rate indicates that the content of your email is relevant enough to the recipient that they want to learn more about your products or services. Thus a higher click-through rate naturally means better traffic and conversions.
The click rate rate is usually about 2-3% and varies by industry.
The click-to-open rate (CTOR) calculates the percentage of recipients who clicked on links within your emails compared to the number of opened emails.
For example, you sent 100 emails, 25 of them were opened, 5 people of those 25 opened the links. It means that your сlick-to-open rate is 5 out of 25, or 20%.
It shows how effectively your campaign has proven itself among an audience that is already engaged enough to open your messages.
This indicator differs from CTR as it does not take into account the total number of emails that you send as part of the campaign. The baseline for this metric is simply the number of people opening an email.
Bounce rate is one of the most important indicators in email analytics. It measures the percentage of emails that have not been delivered to the recipients’ mailboxes.
Emails may not be delivered for various reasons. Bounces can be classified as “hard bounces”, which occur when an email is constantly rejected (for example, due to an incorrect email address), or “soft bounces”, which occur when an email is temporarily not delivered (for example, due to an overflowing mailbox).
The generally accepted bounce rate is below about 2%. So, it’s still normal if 2 out of 100 emails you send will be bounced by the system but pay attention if the bounce rate is more than 2%.
The conversion rate is the percentage of people who perform the action indicated in the email, for example, click on links or images. This metric is a direct indicator of whether your marketing campaign is working at all. That is, whether the recipients of your emails become your customers.
The formula is as follows:
For example, if an email was sent to 100 subscribers and 10 of them clicked on a link to a website, the conversion rate would be 10%.
The higher the conversion rate, the more successful the marketing campaign. A good conversion rate is considered to be from 2 to 5%. But the indicator also depends on the industry.
The low conversion rate indicates that there may be problems with the design of the newsletter, or audience targeting strategies.
Spam rate shows the number of people who reported your email as spam compared to the total number of messages you have sent.
For example, if you send 500 messages and 5 people mark it as spam, your spam rate is 1%. Regardless of the industry, the average spam complaint rate to aim for is 0.1%, or 1 per 1,000 emails sent.
Previously we mentioned bounce rate. Spam has slightly more important input about your marketing campaign. The spam rate shows that your emails were rejected not by the email system, but by people – your subscribers, your old customers or your potential clients. For some reason they were disturbed by your content and even more, they decided to complain about your campaign! Be cautious, high spam rates can negatively impact your sender reputation and the deliverability of other emails.
Good news is that you can significantly reduce spam rate by checking the content of the emails you send to your customers. Pay attention to what kind of links you place in your mails or whether your content might seem offensive to some groups of people, or if there are some images that make your email look like spam and make it harder to read.
The unsubscribe rate measures the percentage of subscribers who opt out of receiving further emails from your list.
Although some outflow of subscribers is inevitable, a consistently high unsubscribe rate shows that your emails are not meeting the expectations of your subscribers; or they are not satisfied with the frequency of your mailing; or they simply lost interest in your products or services (which is mostly not your fault). A good unsubscribe rate is below 0.5%.
Anyway, this is a sign that your email campaign management might need some improvement.
The email sharing/forwarding rate measures the percentage of recipients who forward or share your emails with others. This metric provides insights into the virality of your email content and the extent to which it resonates with your audience.
Forwarding rate indicates interest in your brand. A good forwarding rate is somewhere about 1-2%. By improving it, you can increase brand awareness. In addition, it can work on the principle of “word of mouth” – people are more likely to trust content that friends and acquaintances have recommended to them.
ROI is perhaps the most important metric of all. ROI measures the return on investment generated by your email marketing efforts.
By calculating the revenue generated from email campaigns and comparing it to the costs, businesses can assess the effectiveness of their email marketing strategy. The more ROI is, the more money your campaign actually brought. So if you spend a dollar and then a campaign brings you this dollar back, it is not a good ROI.
Most sources claim that a good return on investment in marketing is 500%, that is, x5 return for every dollar spent on marketing. However, there is no high point – you can do more!
Low ROI is a reason to adjust your marketing strategy. There may be several reasons why you can not reach higher rates of income by your email campaign, but you definitely should go deeper into analytics in order to understand what stops you from getting a good ROI. Maybe your content is not attractive to your customers, or you use instruments that do not work for your subscribers or for the GEO that you are aiming at.
Performing profound email analytics and changing the very approach to your email strategy can boost your ROI and result in better marketing results.
Now that we’ve covered the essential metrics to track, let’s explore how to effectively perform email marketing analysis:
You don’t need to calculate all the formulas yourself and spend the resources of your business when there are already programs that can calculate data in a convenient format specifically for your campaign. You just have to choose the one that is most convenient for you. It should provide all the necessary metrics, as well as have a clear interface.
Selzy has all the necessary tools for convenient email analytics — from basics to advanced metrics.
Evaluate the general metrics that we mentioned above: openings, clicks, as well as bounces and unsubscriptions allow you to assess how your email campaign generally meets the requirements of high-quality mailing and is liked by your subscribers.
After you have evaluated the first results of your email campaign, you can pay attention to individual elements. Namely, to see and compare which elements bring more conversions. Which works better — links or pictures. Which content does your audience interact with best?
Compare and analyze data and customize your campaign based on the results you receive and increase your conversion rate.
Evaluate at what time or in which seasons your campaign brings the best conversions. Or how the dynamics of the campaign develops (or not) over time.
This indicates the general interest of your subscribers in your brand. If it grows over time and the number of conversions increases, congratulations, you are doing a great job.
If user interest is getting lost, you should pay closer attention to your email campaign. Go back to the basic metrics and try to figure out why your emails are losing popularity.
Pay attention to those metrics that allow you to find out a behavioral portrait of your audience – including their geographical location, seasons, and even the time of day at which they prefer to open emails and interact with your content.
Email remains a powerful tool for interacting with customers. A good email campaign not only leads to sales, but also by increasing brand loyalty allows you to get the love of customers for a long time.
However, modern email marketing does not boil down to the principle of “send an email and wait for a sale”. Thanks to modern email analysis capabilities and services that make this process automatic, understandable and convenient, every business is able to study its audience and optimize campaigns in accordance with the needs of its customers and the preferences of its audience.