How to do A/B testing in email marketing
Now that you know which email parameters you can test, let’s take a closer look at the A/B testing process step-by-step.
Set up an objective
The worst thing you can do is start a research without understanding why you do it in the first place. At this stage, the main question you should answer is which metric you want to improve. There are three most popular email metrics for A/B testing:
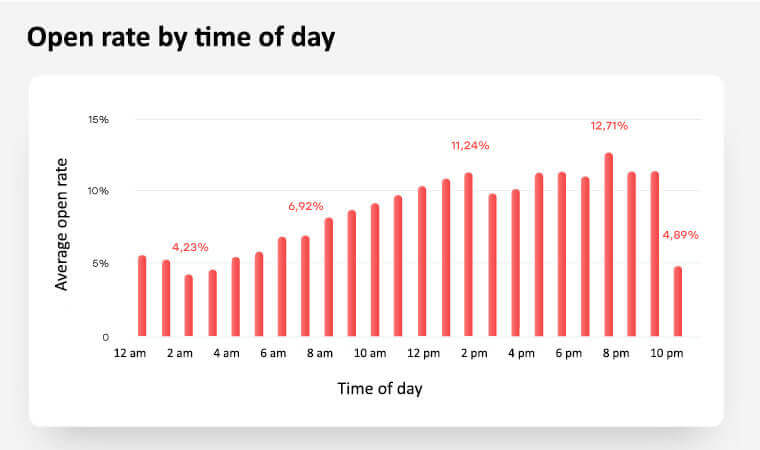
- Open rate — how many people opened your email.
- Click-through rate, or CTR — how many people clicked the links in your email.
- Conversion rate — how many people performed the target action, i. e. signed up for a free trial or bought something using a discount code in your email.
But it’s more than that — your goal should be as specific as possible. For example, goals like “increase visibility” or “re-engage subscribers” are too vague to follow. To run a good A/B test that will improve your campaign’s efficiency, set a measurable objective like “increase the open rate by 15%”.
Pick the variable
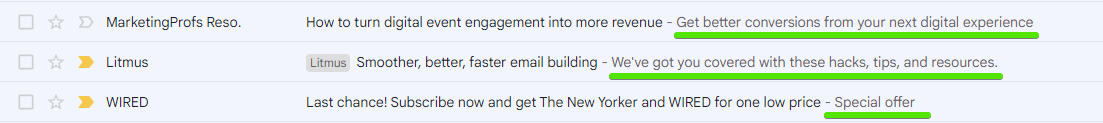
Once you set up a goal, you need to formulate a hypothesis — an assumption that sounds like “Thing X affects metric Y”. The choice of the “X” variable depends on your objective. For example, if you want to improve the open rate, testing subject lines is more reasonable than testing content copies. Look at this spreadsheet if you’re in doubt.
| Email metric |
Best email components to test |
| Open rate |
- Sender name
- Subject lines
- Preview text
- Sending time
|
| CTR |
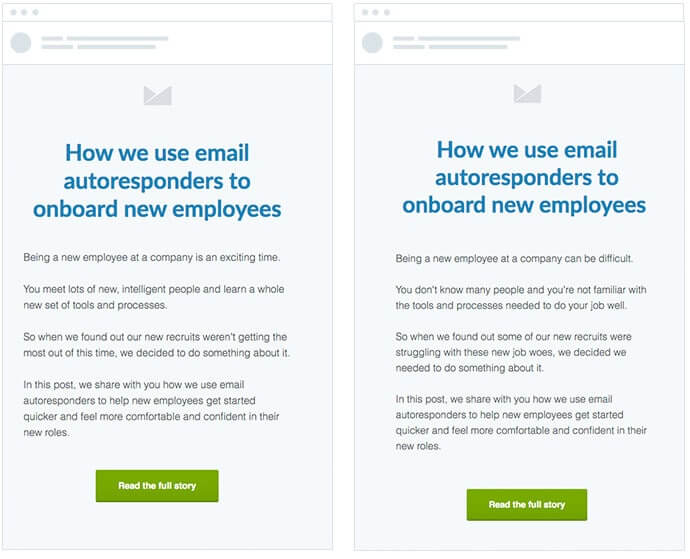
- Content copy
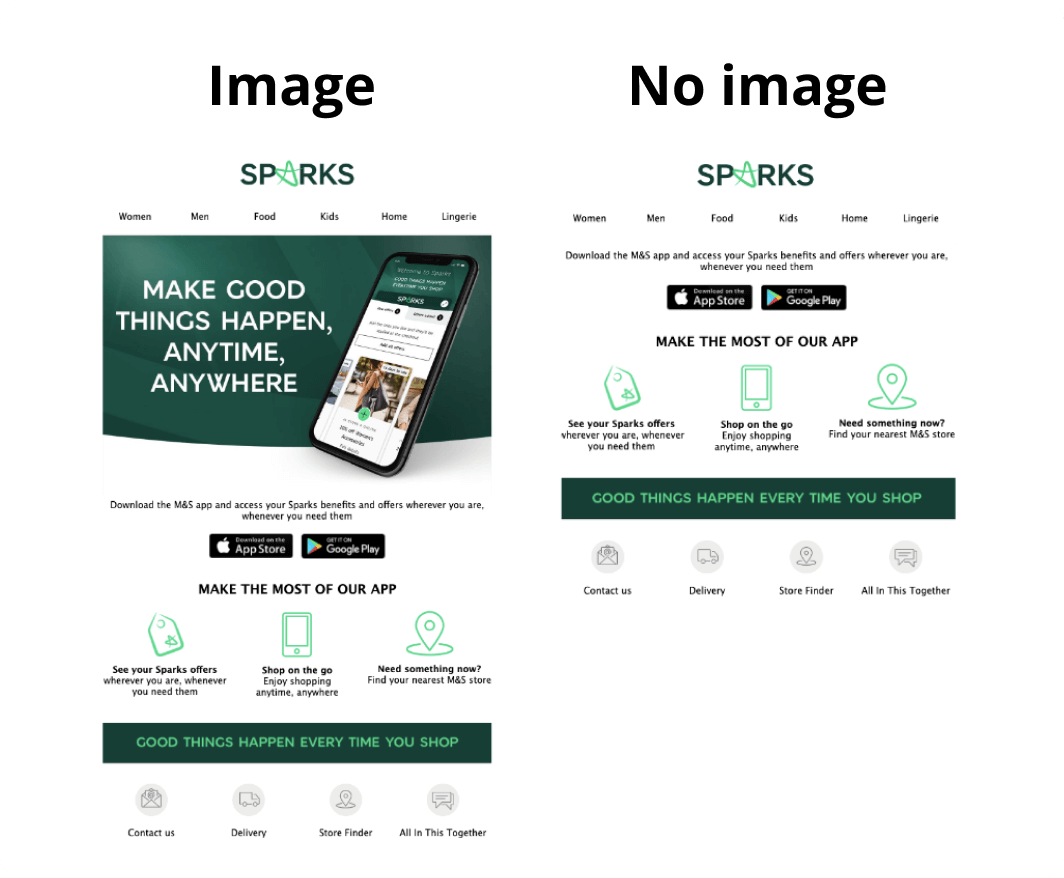
- Email design — visuals, HTML vs. text, layout, etc.
- Sending time
|
| Conversion rate |
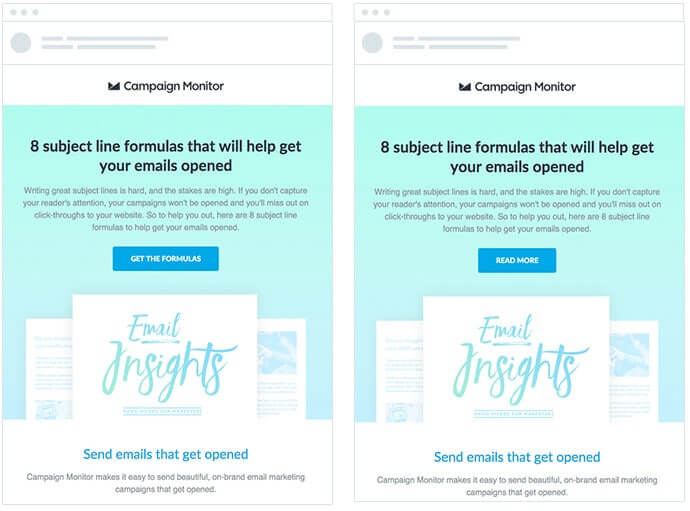
- CTA — both text and button design
- Content copy
- Email design — visuals, HTML vs. text, layout, etc.
|
But no matter which email component you choose, always test one variable at a time. Of course you can, for example, change two subject line features and get four variations like these:
|
First name |
Full name |
| Emojis |
🎉 Alan, here’s your gift! |
🎉 Alan Smithee, here’s your gift! |
| No emojis |
Alan, here’s your gift! |
Alan Smithee, here’s your gift! |
However, if you run a test with these email subjects, you will only find the best combination of the two variables — for example, first name + emoji subject lines might generate the highest open rate compared to other email variations. But this research design doesn’t give you any data about the effects of each variable on its own.
What if you absolutely need to test several variables and find a perfect email subject recipe? The answer is: run these tests separately — it’s simpler and more insightful.
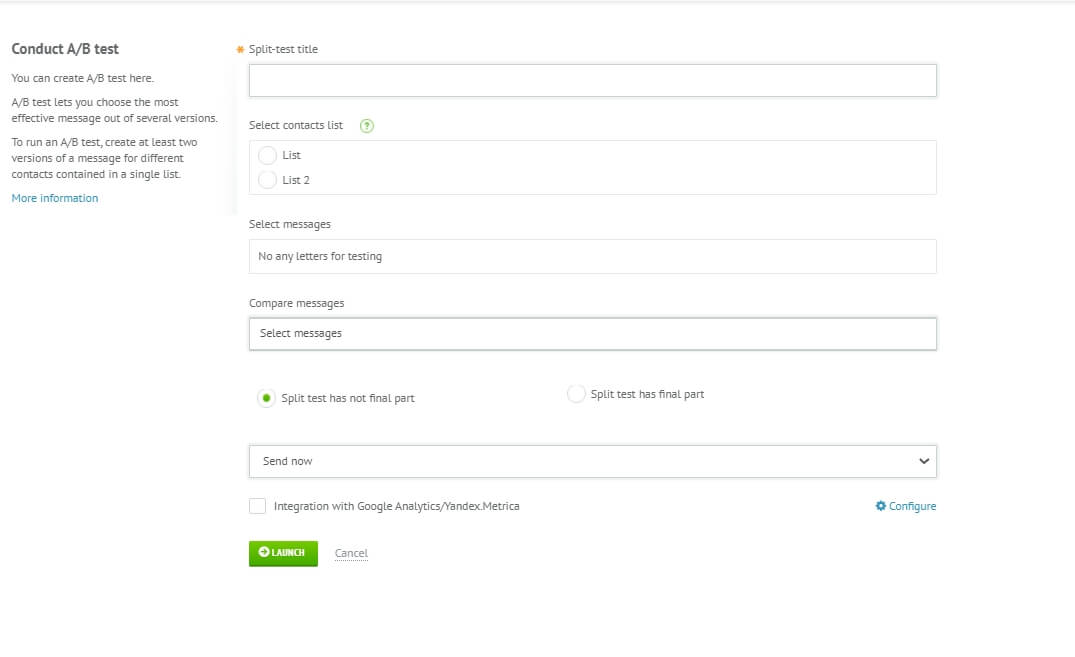
Set up the parameters
The next step defines the conditions for your A/B research, which include timing, sample, confounding variables, and success criteria. Let’s take a closer look at these parameters.
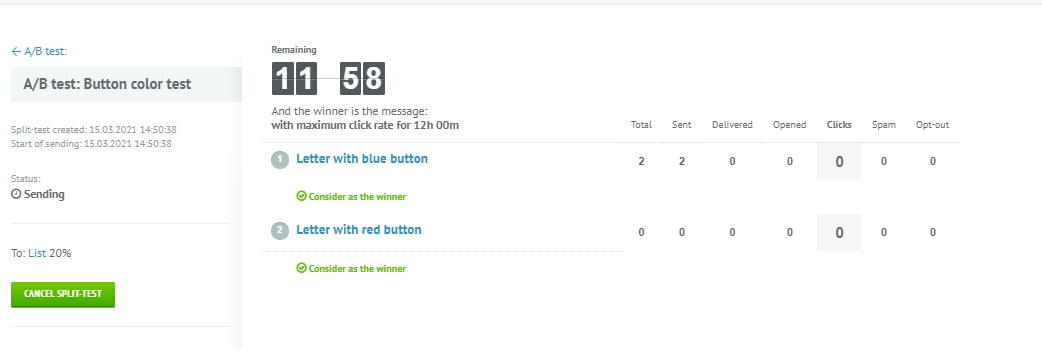
Timing. How long should you wait to get the test results? It depends on your campaign. If you test emails with a limited time offer that expires five hours after sending, stick to these five hours — especially if your metric of interest is conversion rates. But if it’s not your case, analyze your previous campaigns to see when you get the most clicks. For example, if most of your subscribers open the new email within the first 24 hours after you sent it, this is your time frame for the next A/B test.
Sample. To run the test, you need two subsets of subscribers, one for each email variation. Both subsets are modeling your population, which is the entire contact list. It means that these groups should be:
- Representative — for example, if one group only consists of men and the other consists of men and women, these samples are not representative. In this case, the difference in metrics can’t be fully explained by the email variation. To avoid this situation, keep the age and gender ratios in your test groups closer to the same ratios as in your full contact list.
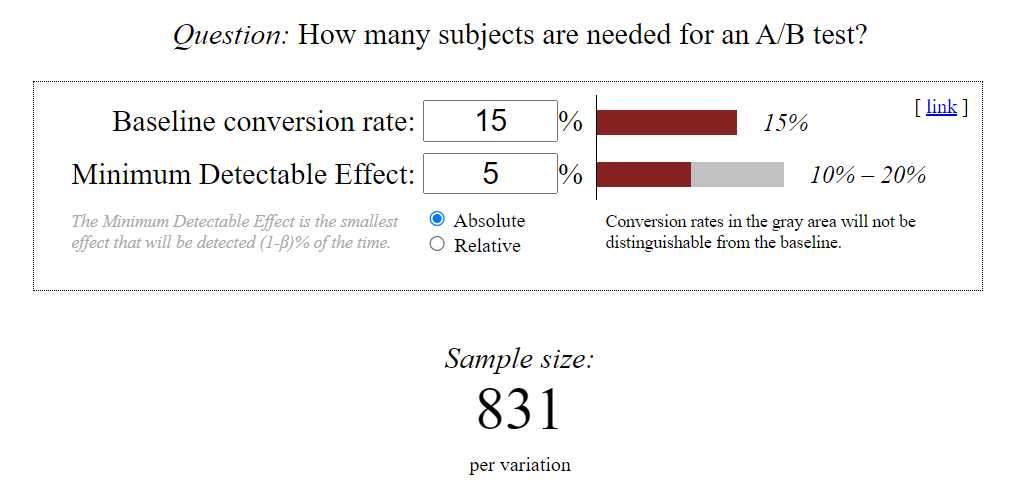
- Large enough for significance — you can’t assume a tendency after just two incidents. If you have less than 1000 subscribers, the best you can do is run a 50/50 test on the entire list. But if your readership is larger than that, calculate the sample size using online calculators — like this one. For example, if your average open rate is 15% and you consider an at least 5% increase significant, each of your groups should have 831 subscribers.