
This benchmark research looks at the performance of email marketing by analyzing over 40 billion emails sent by Selzy users between 2020 and 2024.
It also includes industry averages from different sources, looks at industry changes from 2020 to 2024, and is backed up by studies and research findings.
The research looked at over 40 billion marketing emails sent by Selzy users from 2020 to 2024 to learn more about email marketing performance. We also checked industry averages from different platforms, focusing on industries covered by all sources, for which Selzy has enough data to make conclusions. The research examined email performance over the 2020-2024 timeframe to understand the perspective of email performance trends.
To show a full picture of email performance rates across different industries, public data from 2024 and Selzy's data from 2020 to 2023 were used.
We looked at industry and business reports, along with research from well-known sources like Statista, Litmus, Accenture, Grand View Research, and Q1 academic journals. Combining data and expert opinions helped us come up with helpful tips for improving email marketing across industries.
Keep in mind that these are averages. A campaign's success can change a lot based on things like the domain's reputation, the email service provider's quality of contact lists and email content, and more. Also, the data might have been affected by differences in how each publication collects data.
To gain a competitive advantage, industry, and regional benchmarks continuously come in handy to analyze email marketing effectiveness within the broader landscape.
Benchmarks provide performance guidelines:
To get a leg up on the competition, industry and regional benchmarks are really useful for figuring out how well your email marketing is doing compared to the bigger picture.
Benchmarks help you improve:
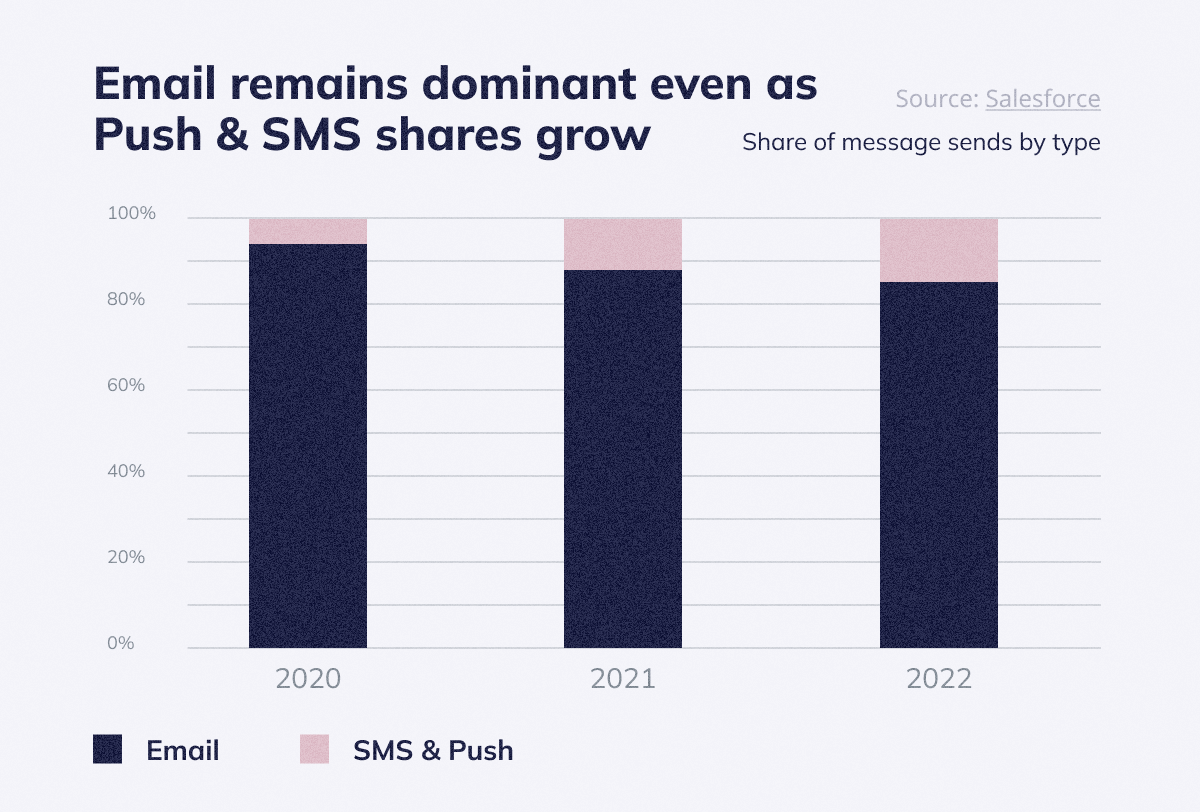
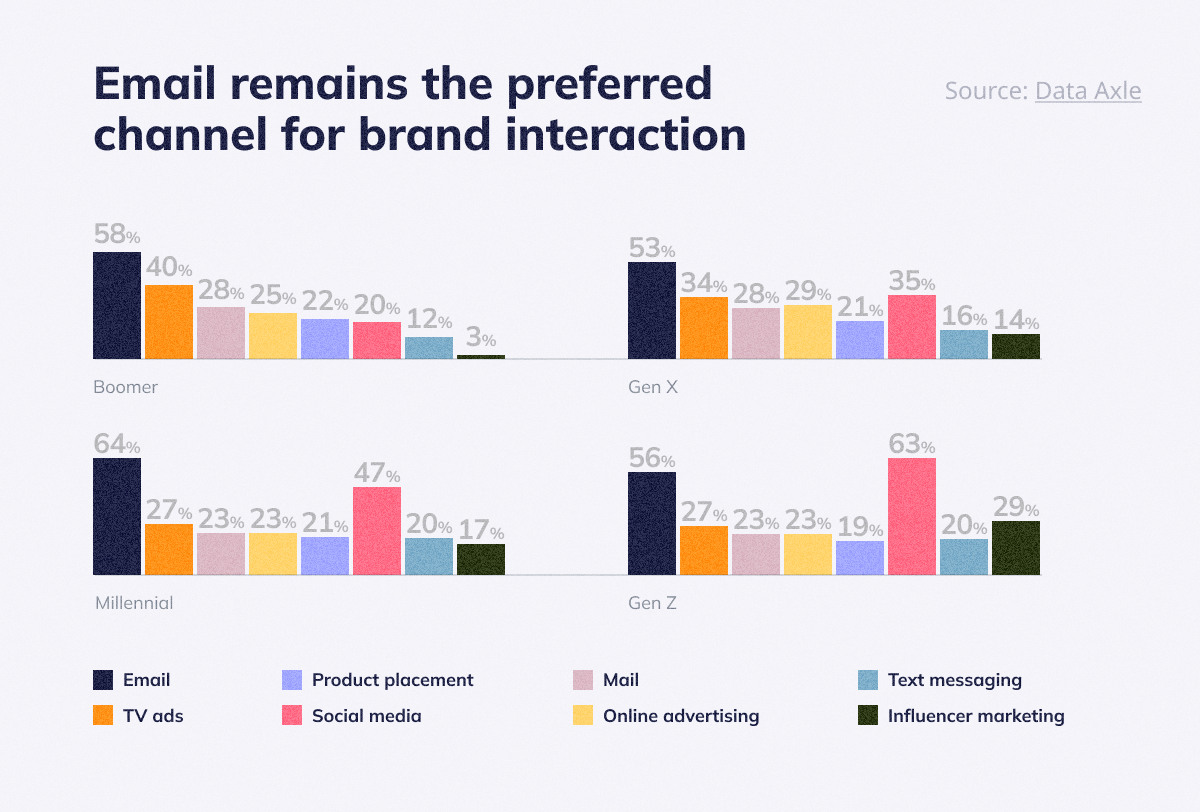
Email is still a powerful tool when used with other marketing efforts:
Because email is still important and reliable, it's really important to look at your email marketing strategy and make it better so you can succeed for a long time.
Delivery rate (%) = (Delivered emails / Total emails sent) x 100Deliverability rate (%) = Delivery rate - Spam rate and Bounce rate
While both provide information on how your emails are getting to people, there's a big difference between email delivery rate and email deliverability rate.
While both terms relate to getting your emails to recipients, there's a critical distinction between email delivery rate and email deliverability rate.
A good deliverability score means your emails reach inboxes and avoid spam filters. Deliverability has a direct impact on audience engagement. (Selzy)
Why is deliverability important?
Challenges and considerations:
A good deliverability score indicates your emails reach inboxes and avoid spam filters. Deliverability has a direct impact on audience engagement.
Email bounce rate is the percentage of emails that weren't delivered. It helps you understand if there are problems stopping your communication efforts.
Bounces happen when emails get sent back to the sender because of delivery problems. There are two main types of bounces: hard and soft.
Soft bounces:
Cause: Temporary problems, like full inboxes, server problems, inactive accounts, and temporary emails.
Outcome: The email isn't delivered right away but might be delivered later.
Impact: This can hurt the sender’s reputation if it's not fixed or if it happens often. These issues might fix themselves, but you should keep an eye on them to fix problems quickly. For example, if emails are sent too often, or files are too big.
Hard bounces:
Cause: Permanent problems, like invalid email addresses, domain names, or authentication failures.
Outcome: The email can't be delivered permanently and won't be delivered.
Impact: Hurts the sender’s reputation and can cause more problems with email deliverability.
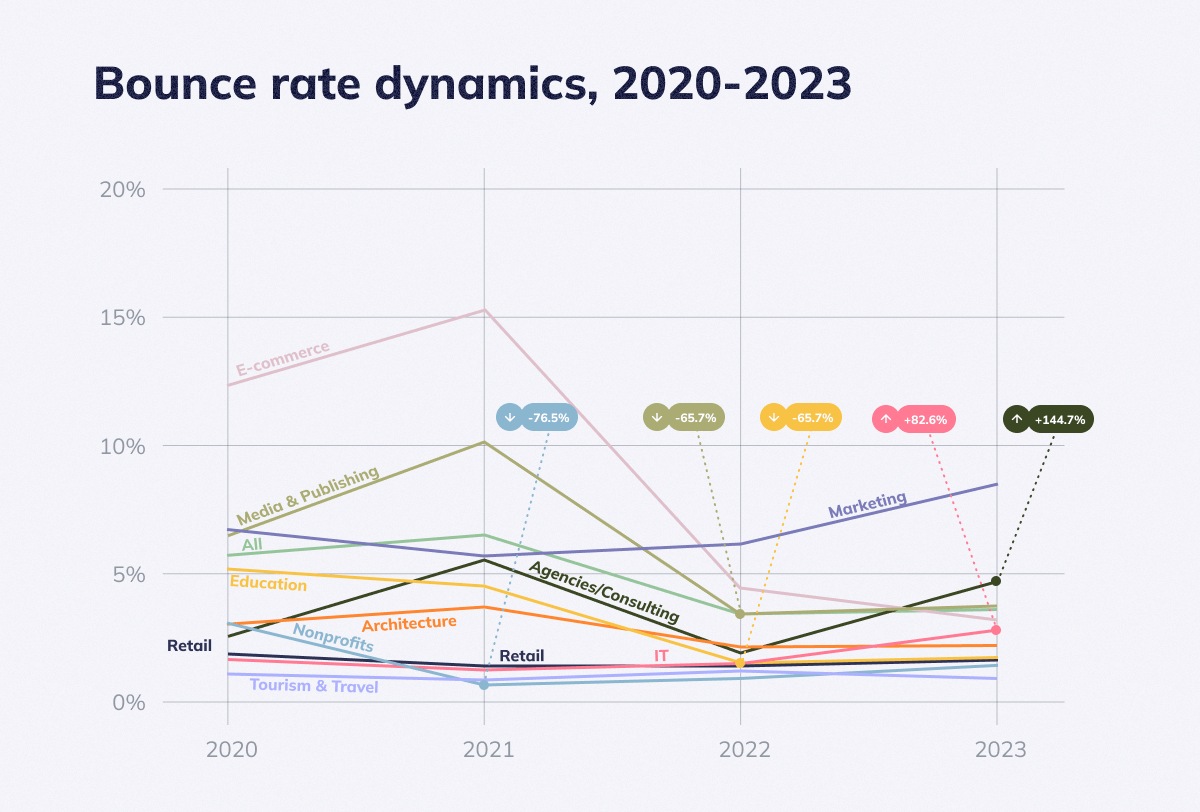
According to Selzy, bounce rates went down a little by 0.4%, going from 5.68% in 2020 to 3.55% in 2023.
The E-commerce and Retail industries saw the biggest improvement in bounce rates of 0.7% from 2020 to 2023.
In 2023, Agencies/Consulting had the biggest increase of +144,7% in bounces, followed by IT with +82.6%. Tourism & Travel and E-commerce, on the other hand, were the only two industries showing a decrease in bounce rates. Tourism & Travel is down by 25.8% from 2022, E-commerce -28.4% from 2022.
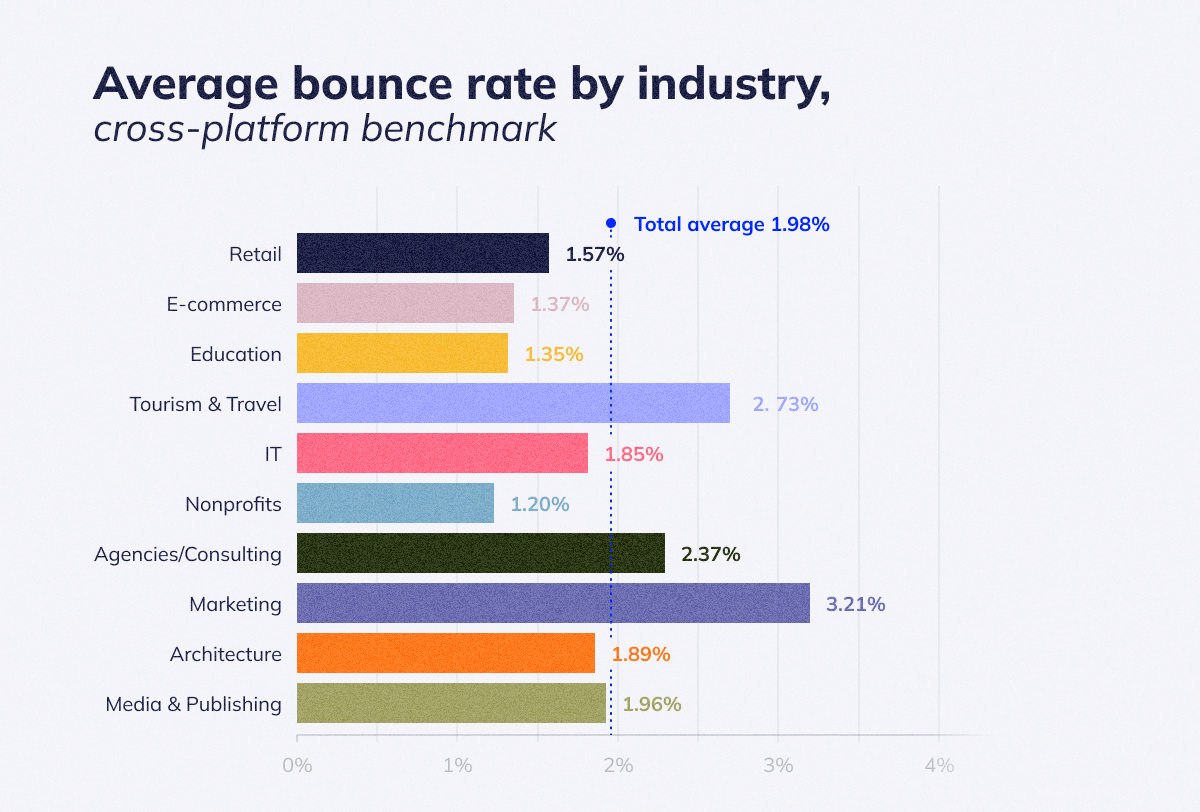
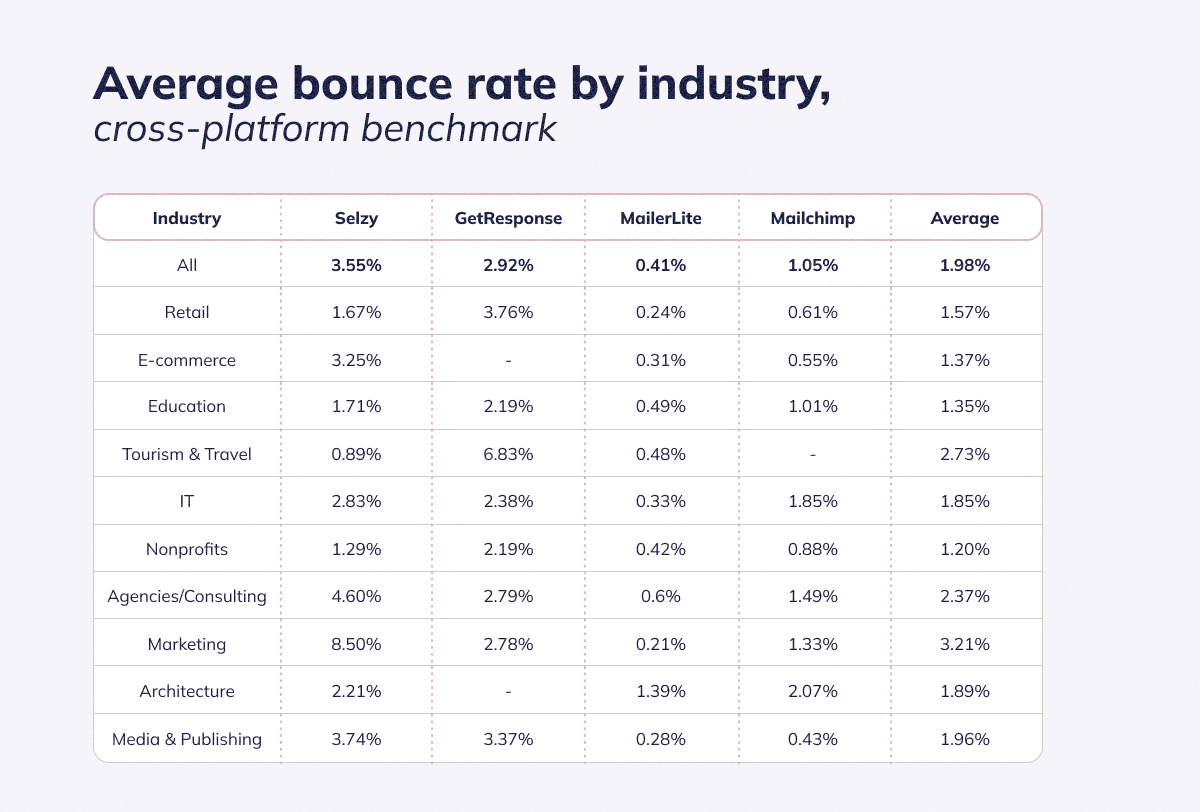
The average bounce rate across all industries is 1.98%.
Looking at the average bounce rates for each industry shows that Marketing and Tourism & Travel have the highest average bounce rates. In contrast, Nonprofits, Education, and E-commerce have the lowest.
Marketing (97%), E-commerce (93%) and Media & Publishing (93%) have the highest percentage of soft bounces against the overall rate.
Several things might cause this, including:
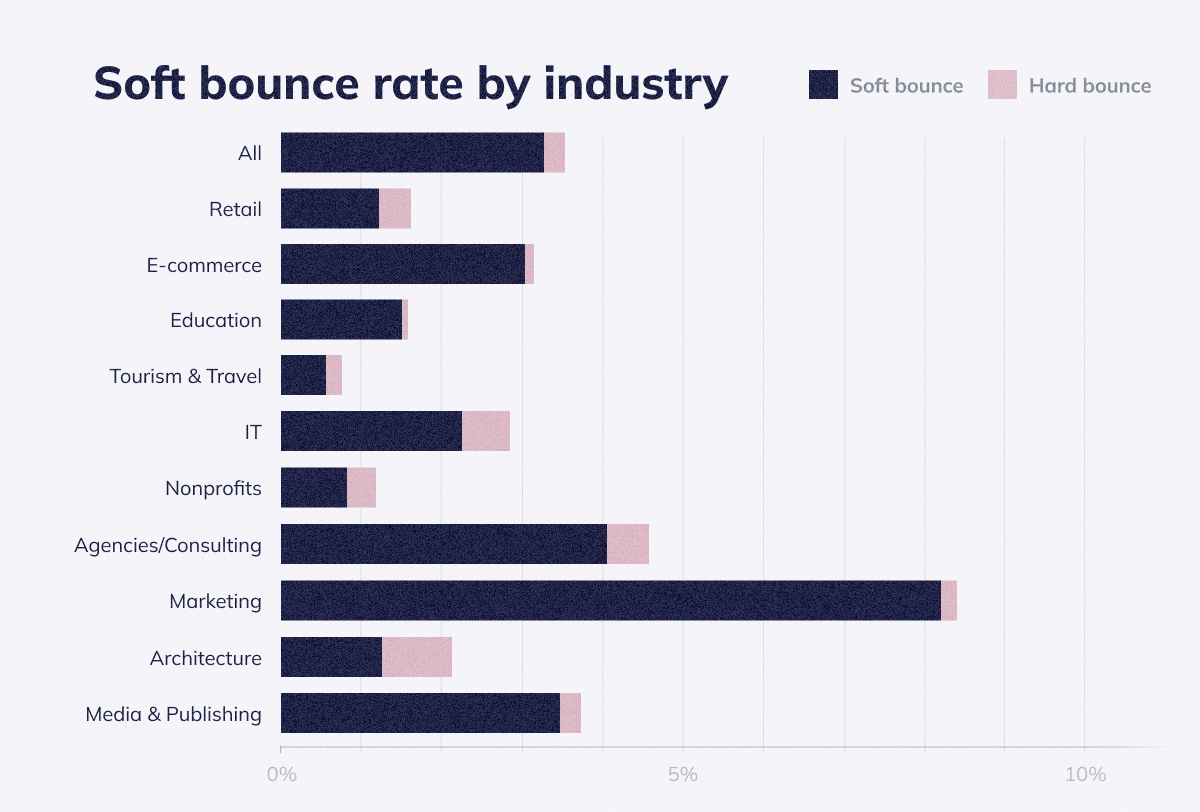
Overall, this benchmark shows that soft bounces happen more often than hard bounces, which is good news. The bad news is bounce rates go up over time. Tourism & Travel and E-commerce are the industries to learn from.
The email open rate is the first sign of how engaged people are with your email marketing efforts. It tells you what percentage of delivered emails were opened. This metric shows you how many recipients were interested in your message.
Open rates give you useful insights, but there are some key things to keep in mind:
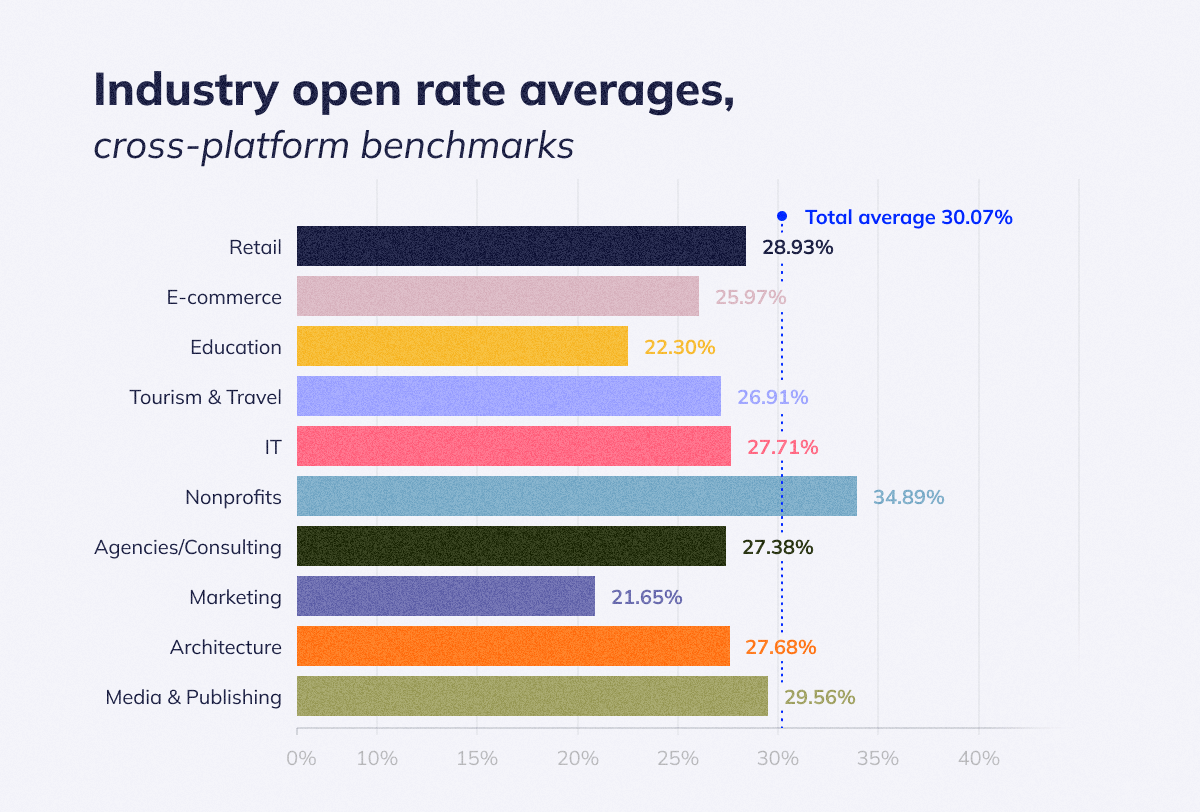
Looking at benchmarks from different platforms, the overall average open rate is 30.07%. Nonprofits are in the lead with an open rate of 34.89%, while Marketing has the lowest open rate at 21.65%.
Building on the overall open rate, the unique open rate is a more accurate way to measure how engaged each recipient is. It gets rid of duplicate counts by counting each unique recipient's interaction with your email only once, no matter how many times they open it.
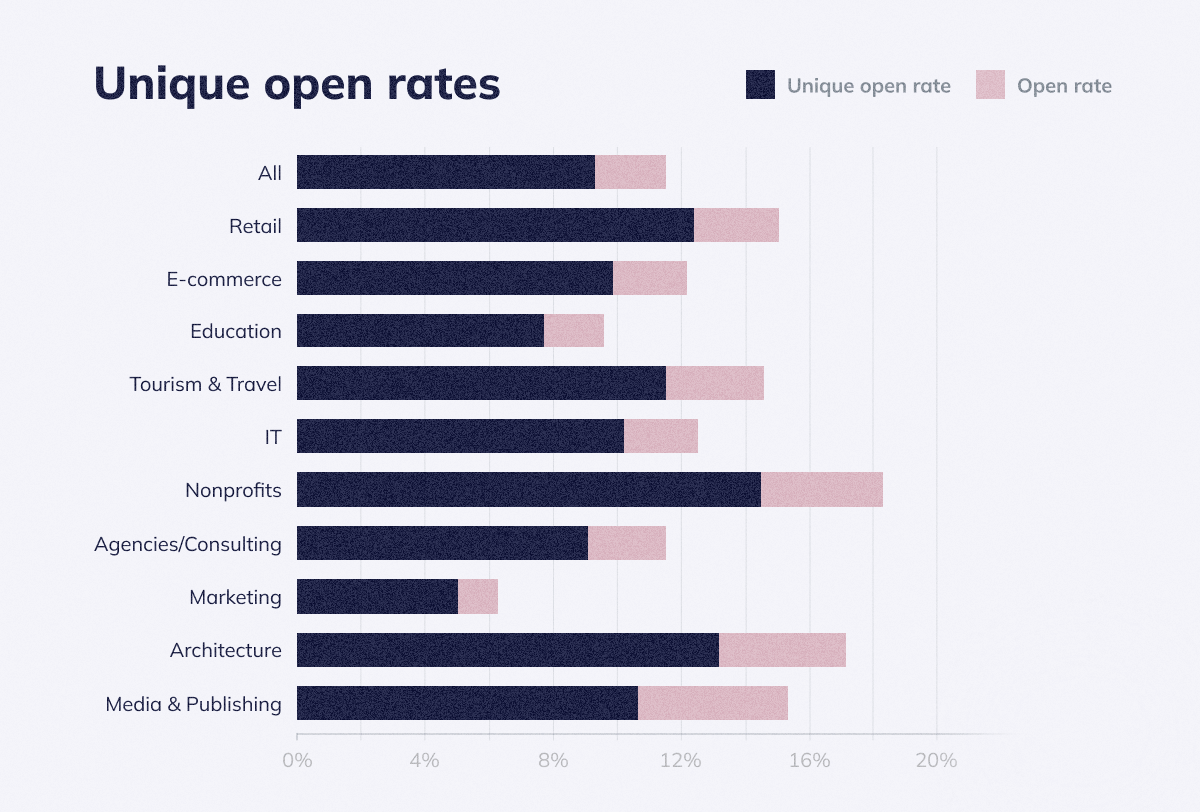
The overall open rate is still useful as a measure of engagement, but it's important to look at it along with the unique open rate to get a more accurate idea of how each subscriber is behaving. Also, multiple opens aren't necessarily bad. They might mean someone is really interested in your content.
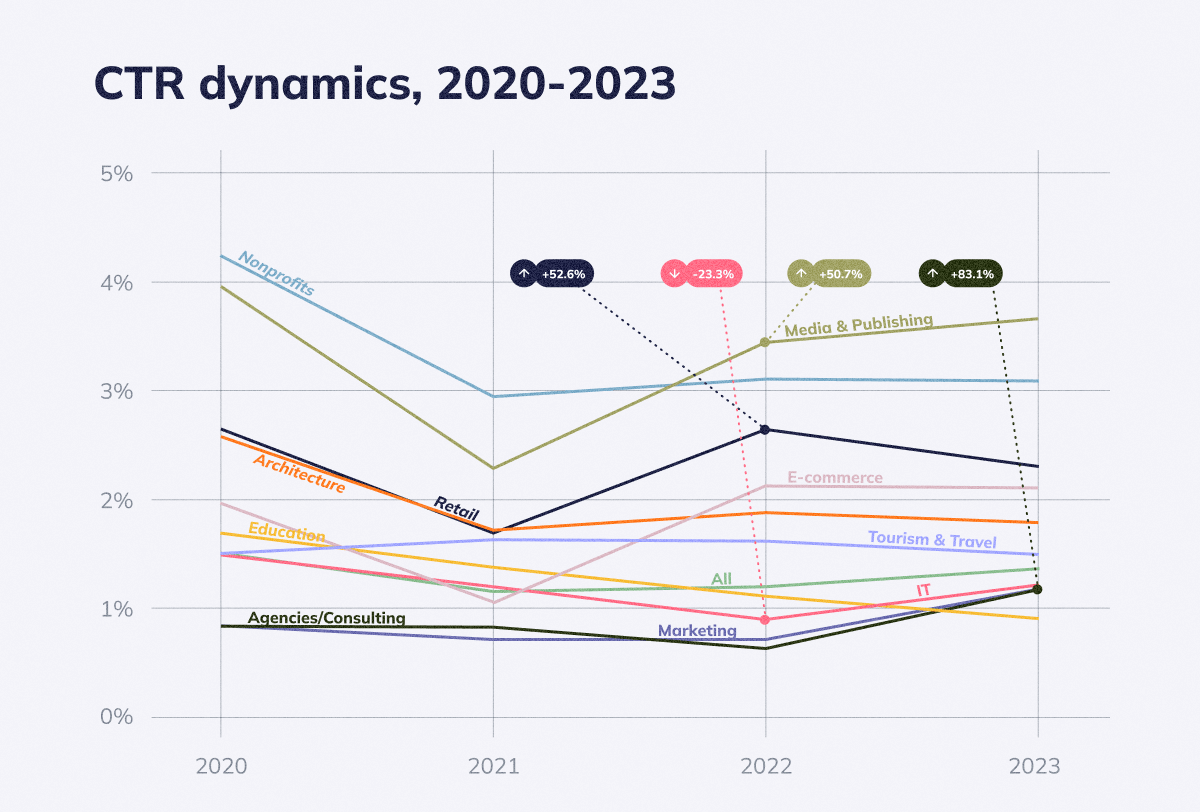
Looking beyond initial engagement, the email click-through rate (CTR) goes deeper, showing what percentage of recipients clicked on a link in your delivered emails. The CTR shows how many recipients were interested enough to click and learn more after opening your message.
The CTR gives you useful insights:
Research by Mailсhimp shows that segmented email campaigns can outperform campaigns that aren't targeted by 100.95% in terms of CTR. (Mailchimp) Dividing your audience into groups, tailoring content, and using CTAs can greatly boost engagement and click-through rates.
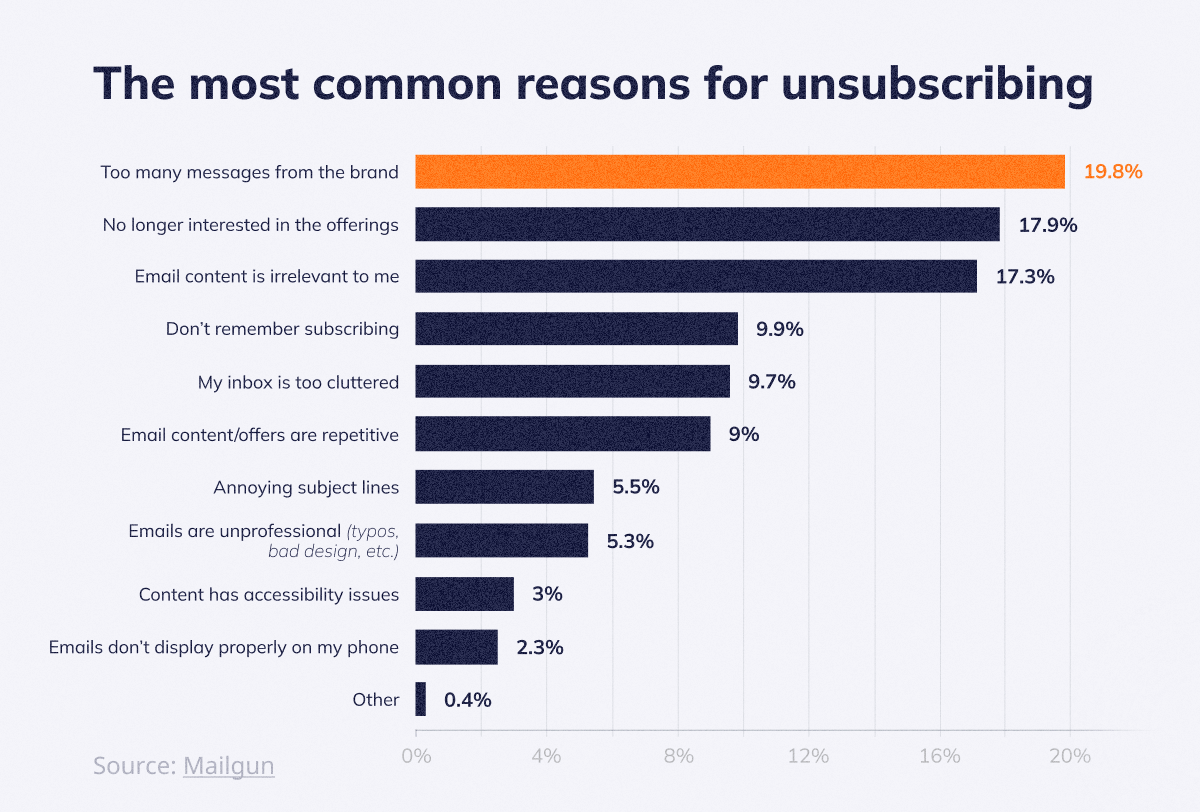
The unsubscribe rate is the percentage of recipients who choose to opt out of your email list per delivered email, which can be good and bad. Unsubscription might seem like a bad thing at first, but you can still learn a lot from unsubscribe data.
Research by Mailgun shows the top 3 reasons for unsubscribes:
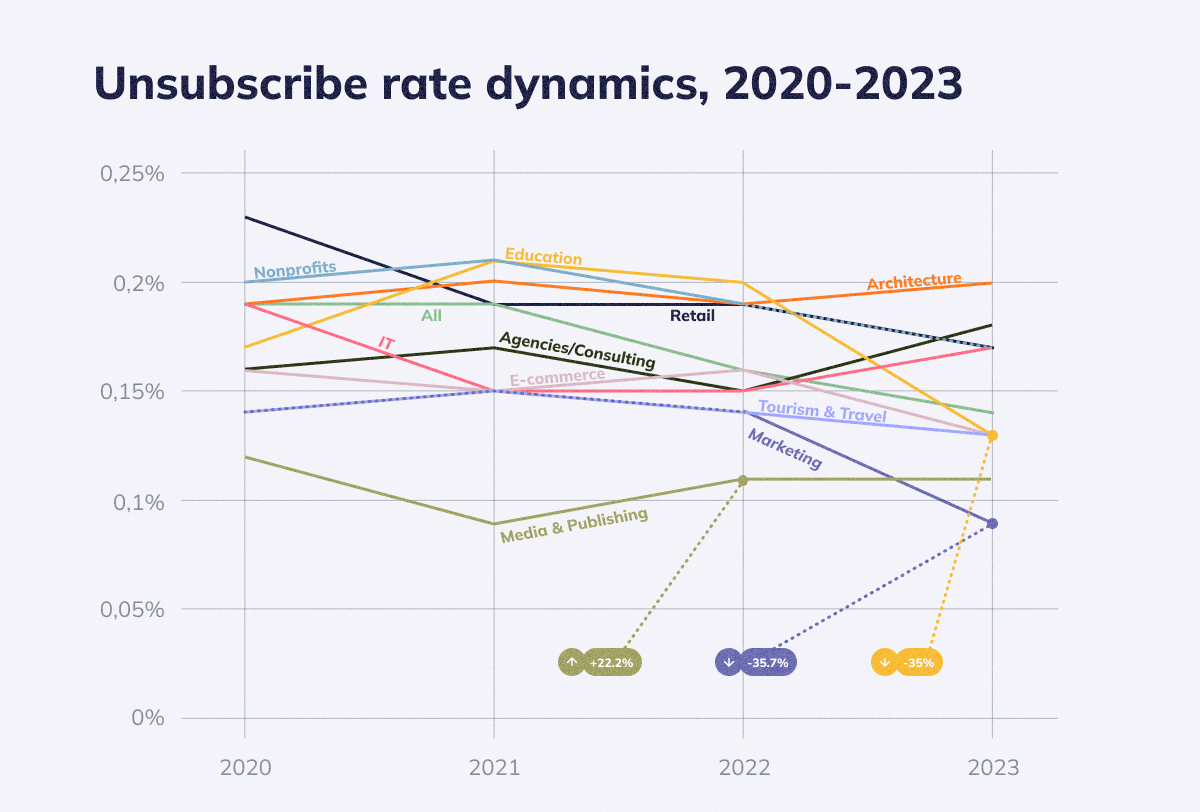
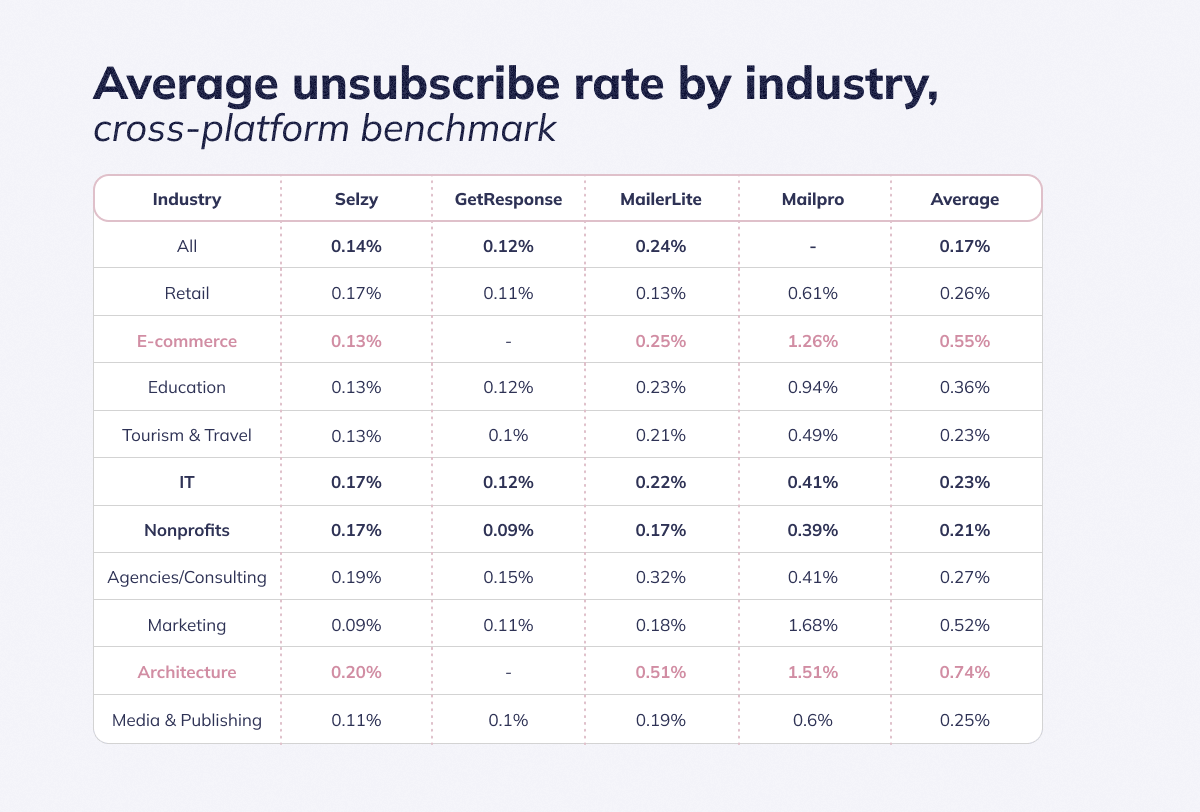
In 2023 the overall unsubscribe rate average was 0.14%.
The top 3 industries with the highest average unsubscribe rate:
Top 3 industries with the lowest unsubscribe rate:
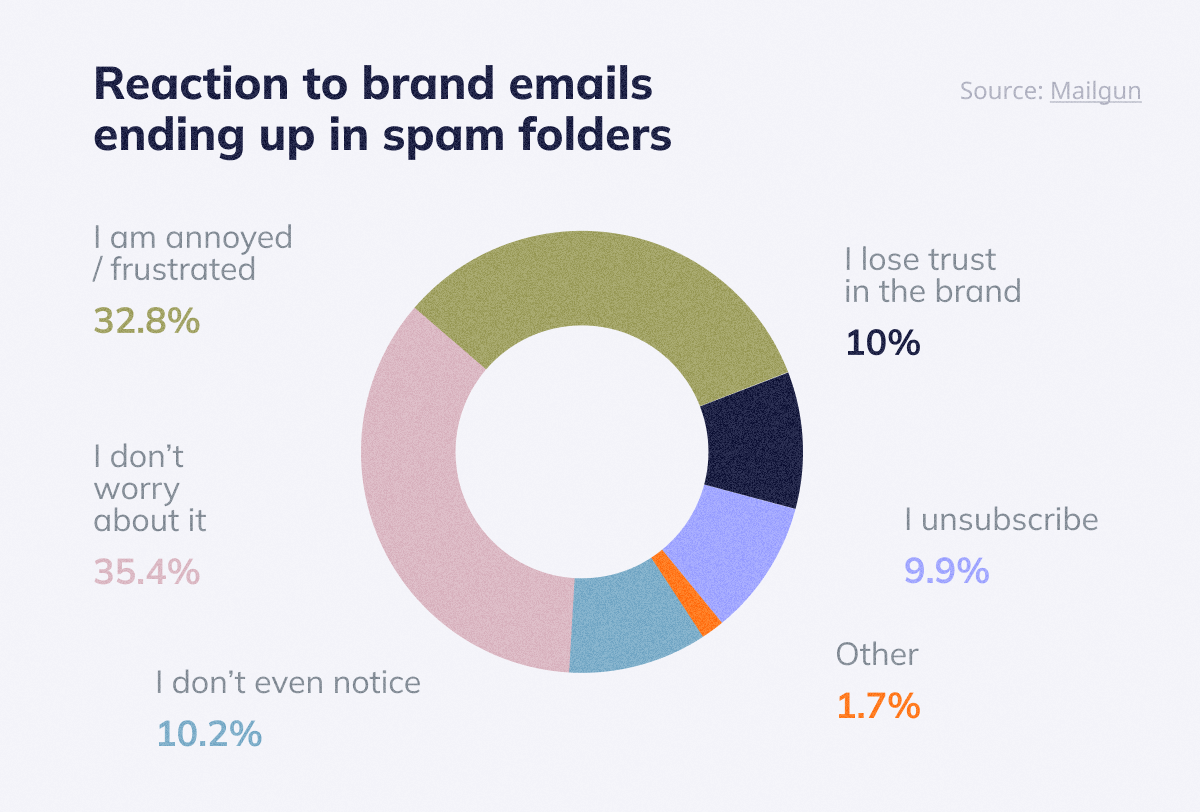
Spam rate covers a crucial aspect – avoiding the spam folder. It indicates the percentage of recipients who mark emails as spam.
Having emails marked as spam can be bad for email marketing efforts, affecting engagement, how much people trust your brand, and deliverability.
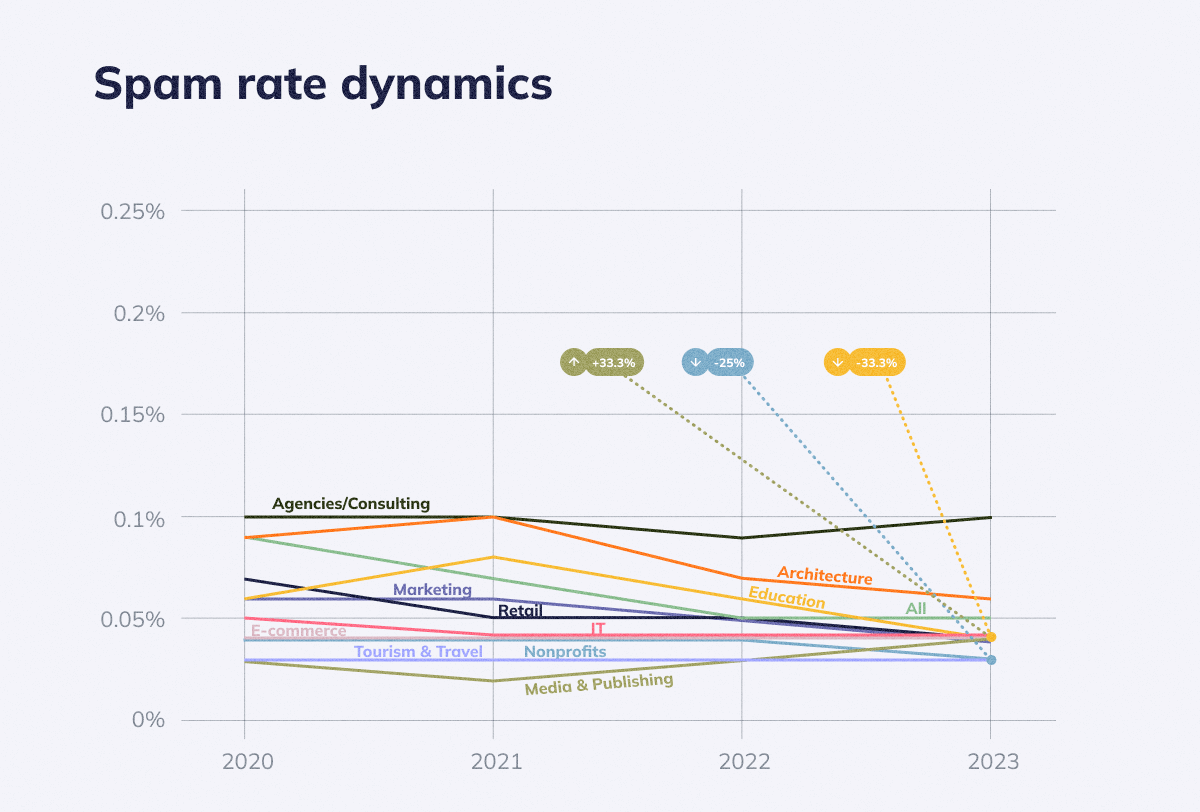
The overall spam rate in 2023 was 0.05%, which is 44.4% lower than in 2020 when it was 0.09%.
Education and Nonprofits saw the biggest decrease in spam rates in 2023, going down by 33.3% and 25%, while in Media & Publishing, spam rates went up by 33.3%.
Media & Publishing has been having trouble with spam rates since 2021, with the industry's spam rates doubling in three years.
E-commerce and Tourism & Travel spam rates stayed the same over four years at 0.04% and 0.03%. Agencies/Consulting's spam rate was also pretty stable at 0.1%, but the industry is at risk because the spam rate should be below 0.1%.
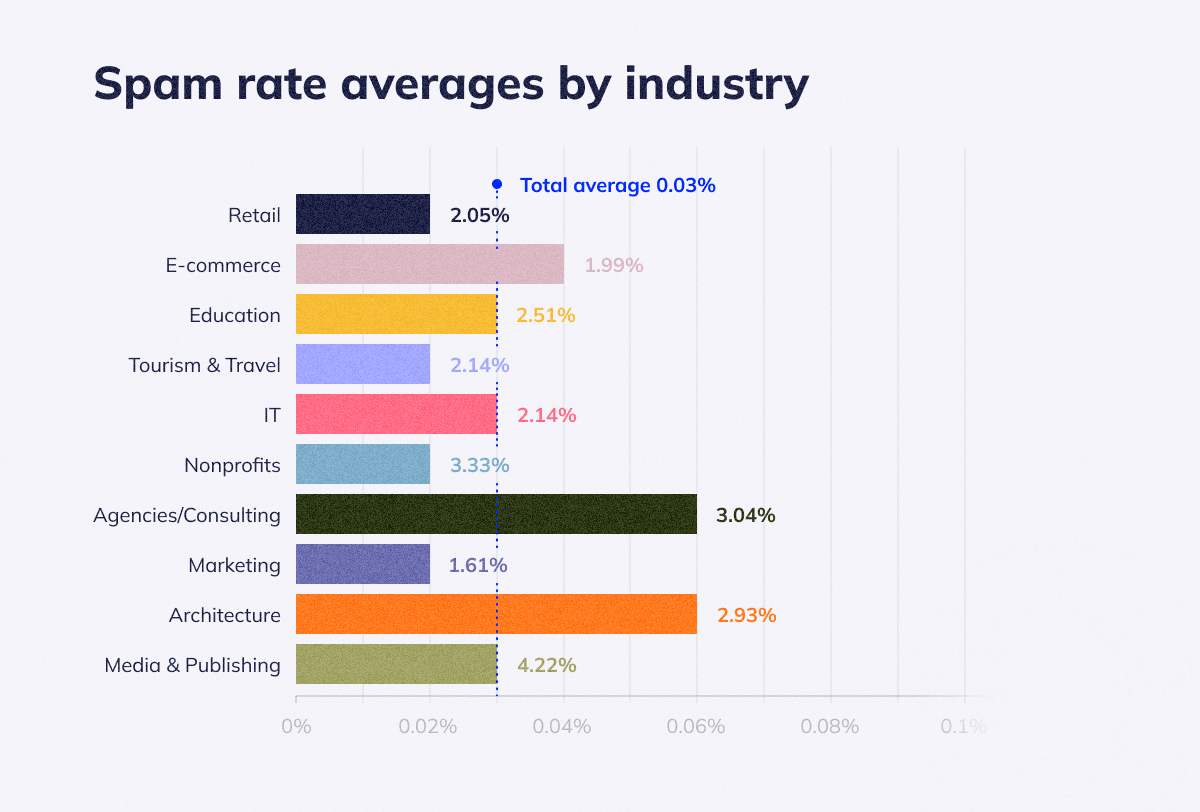
After analyzing email benchmarks from Selzy and GetResponse, we found that the average overall spam rate is 0.03%.
The lowest spam rate averages across industries were at 0.02% in four business sectors:
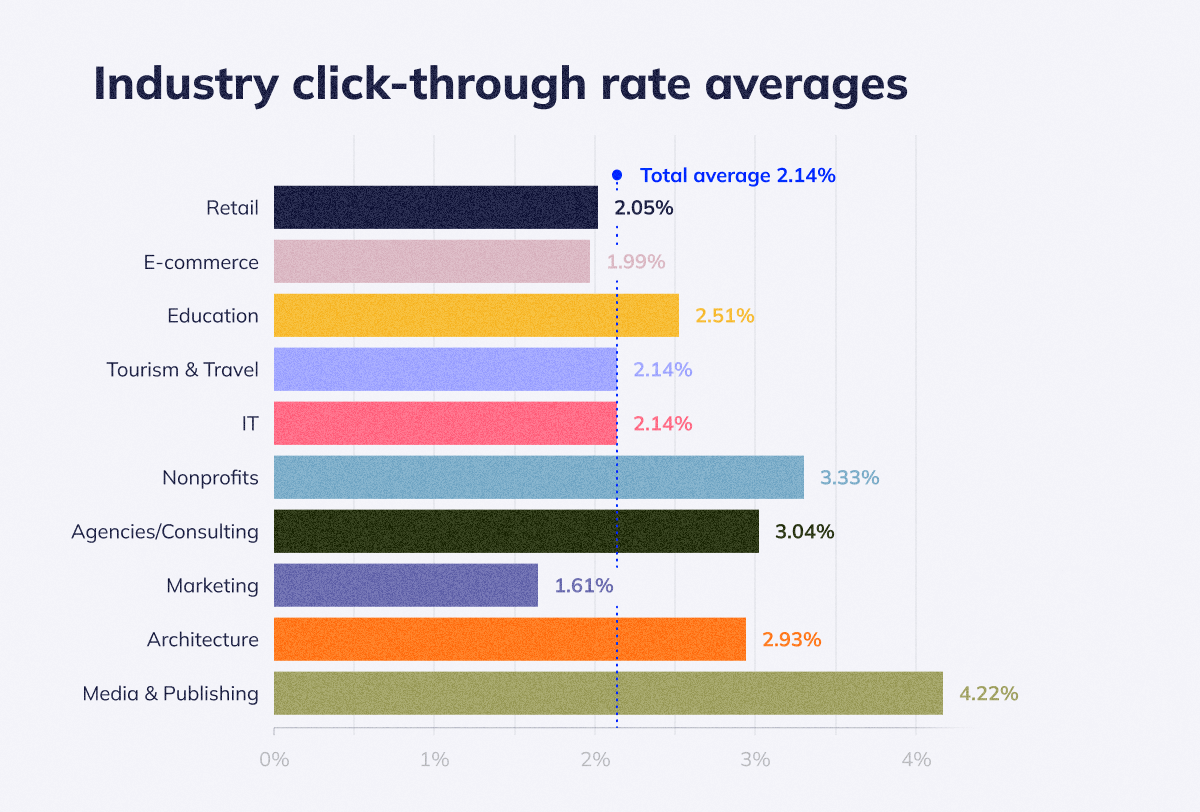
Agencies & Consulting with 3.04% and Architecture with 2,93% have the highest spam rate averages across industries.
If a spam rate goes up a lot, mailbox providers will quarantine or block the messages. Even legitimate emails sent to real customers and subscribers who opted in earlier could end up in spam. In 2024, Gmail and Yahoo said they'll start using spam complaint thresholds. People who send out a lot of emails need to keep spam rates below 0.1% consistently and avoid having big jumps of 0.3%.
Essential best practices and recommendations to elevate email marketing
The main reason for this study was to understand how to make email marketing better all the time.
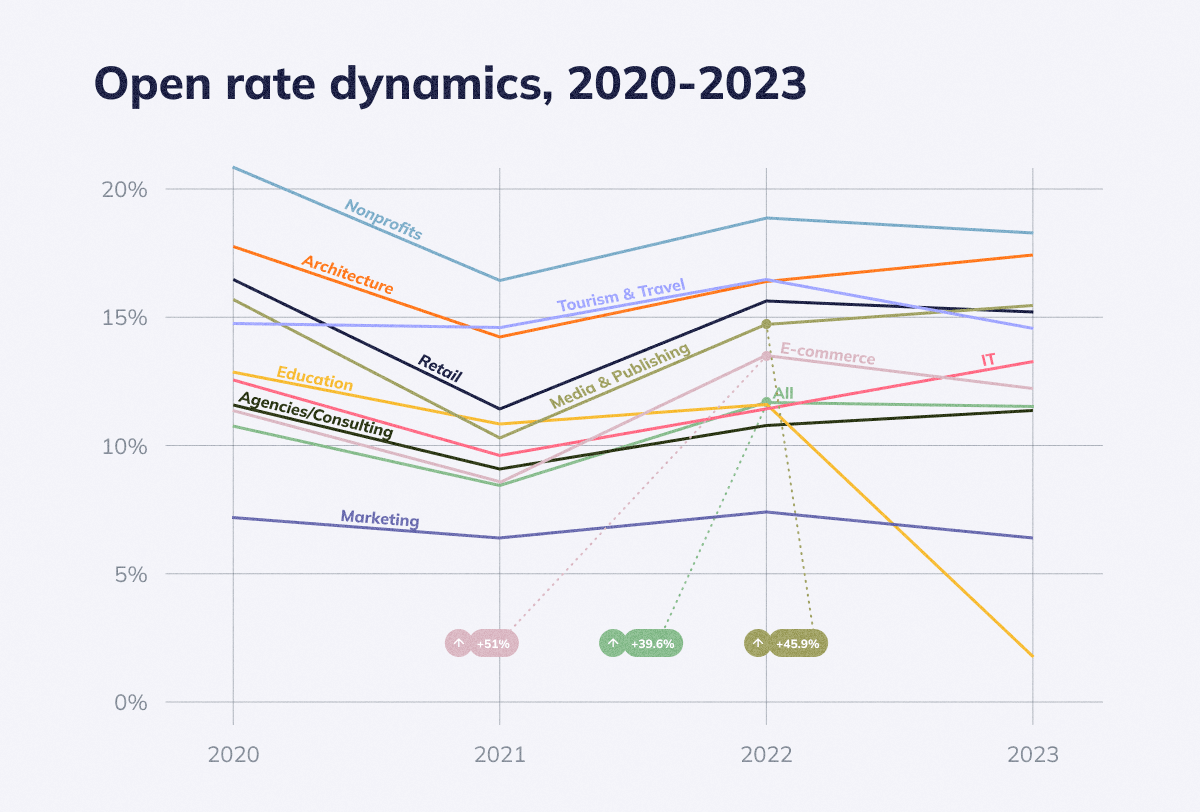
In this research, we looked at average email performance rates by industry between 2020 and 2023. The main finding is that people's behavior changes because of changes in the digital, economic, and geopolitical environment. Because people can access information more easily, behavior changes quickly, and small trends can be confusing. To keep up with things now, you need a lot of data, to be able to change quickly, and to stay on top of global trends and new things that companies and governments are doing.
This section explores advanced strategies to improve email marketing including automation, email acquisition, and the power of creativity.
Mailbox providers measure how good your domain is. The better your reputation is, the more email services trust emails coming from your domain and put them in recipients’ inboxes. The system of points awarded is kept secret for safety reasons.
Mailbox providers have analytical tools called postmasters. They analyze deliverability, spam complaints, IPs, and domain reputations. Gmail, Outlook, Yahoo, and each popular mailbox provider has its postmaster. One of the most popular ones is Google Postmaster Tools which analyzes emails sent into Gmail mailboxes. (Selzy)
Major email providers like Google and Yahoo are making sending requirements stricter to improve the user experience and security. While they were considered best practices before, several requirements have become mandatory since 2024:
Combining authentication, anti-spam practices, and list management is essential for making your email campaigns work as well as possible.
It's getting more and more complicated to create a winning email strategy. Nowadays, people have more freedom to change their careers and goals throughout their lives and, at the same time, face the most destructive economic events. Changing social values and economic challenges are making people want flexibility and the ability to adapt to a changing world.
Relying just on demographic data like age, gender, and location isn't enough anymore to predict what customers need and want. As people expect more personalized experiences, organizations need to adapt to this changing environment. Focusing on individuals and their journeys can lead to deeper engagement and better results.
Data has become the most important part of successful marketing strategies. The digital marketing software market was projected to have a 17.8% CAGR from 2020 to 2030 (Grand View Research). Useful insights from data analysis have gone from being a supporting element to being a mission-critical part of things.
Marketers are investing more in tools and technologies that combine data efficiently:
This gives brands the power to understand individual preferences and behavior better., send targeted messages at the right time and through the right channels and tailor content and offers for each recipient, which makes engagement and conversions better.
Also, research from Litmus shows the big advantages of using third-party analytics tools. Companies that use third-party analytics:
These findings mean a higher return on investment (ROI):
Despite the benefits, many companies struggle to use data effectively:
Making choices based on data and tech can dramatically change your email marketing efforts. Guessing isn't an option anymore; a strategically driven powerhouse is the way to go. Data unlocks personalized experiences, boosts engagement, and gets better results.
Building on the foundation of data-driven decision-making, here we look at how marketing automation makes email marketing even better.
The global marketing automation industry is taking off and is expected to more than double from 2023 to 2030. A lot of companies are realizing how great automation is.
About 60% of marketing leaders across the world are planning to spend more on automation. (Statista) Almost all marketers (98%) say that marketing automation is a must for success. (Adobe)
Automation has a lot of benefits, including:
Email automation depends on data. 41% of email orders came from just 2% of automated emails in 2023. (Omnisend)
Automated emails do way better than regular campaigns:
| Automated emails | Traditional email campaigns | |
| Open rates | 42.1% | 25.2% |
| Click rates | 5.4% | 1.5% |
| Conversion rates | 1.9% | 0.5% |
Source: Omnisend
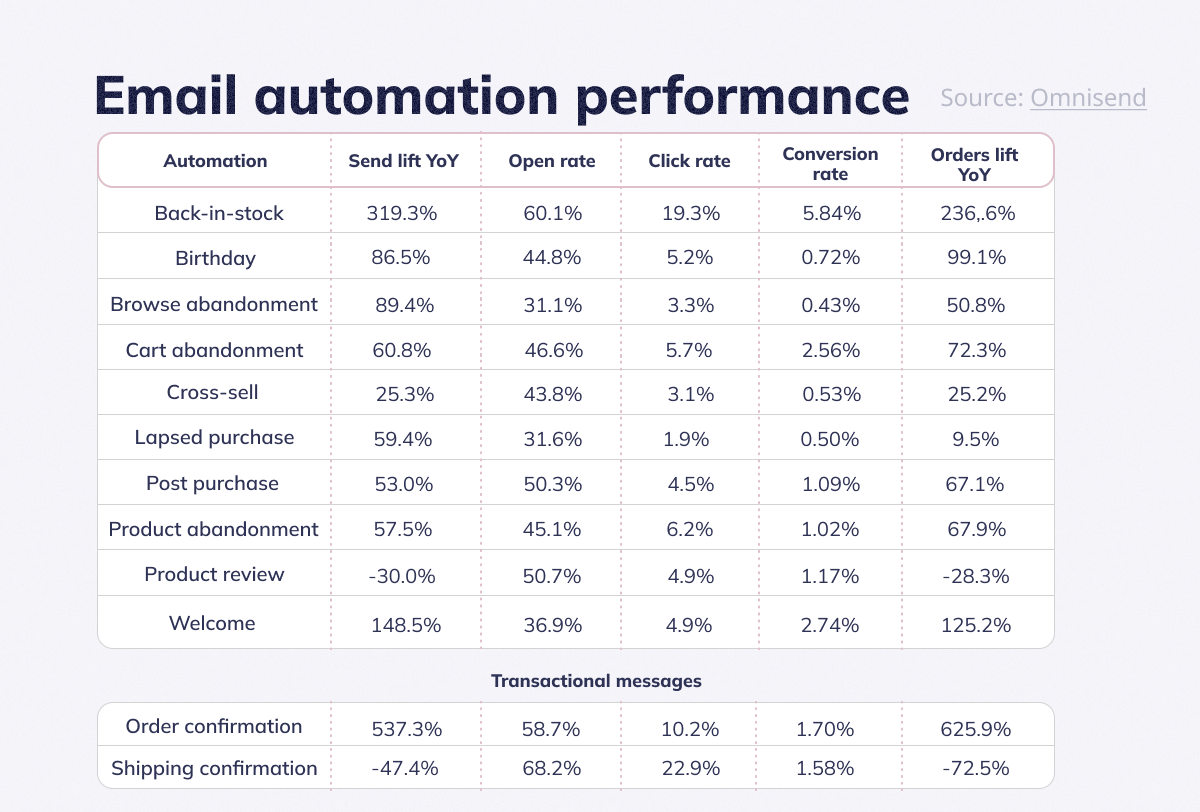
Automation isn't just for e-commerce, it works in lots of different industries.
Lands' End used first-party data (email activity, purchase history, browsing behavior, product interests) to make 15+ personalized trigger emails. This program had a 158% higher conversion rate (purchase per email click) than the industry average. Lands' End mixes data with testing to figure out the best message frequency and volume. (Data Axle)
Automation can help make things easier, save money and make customers loyal.
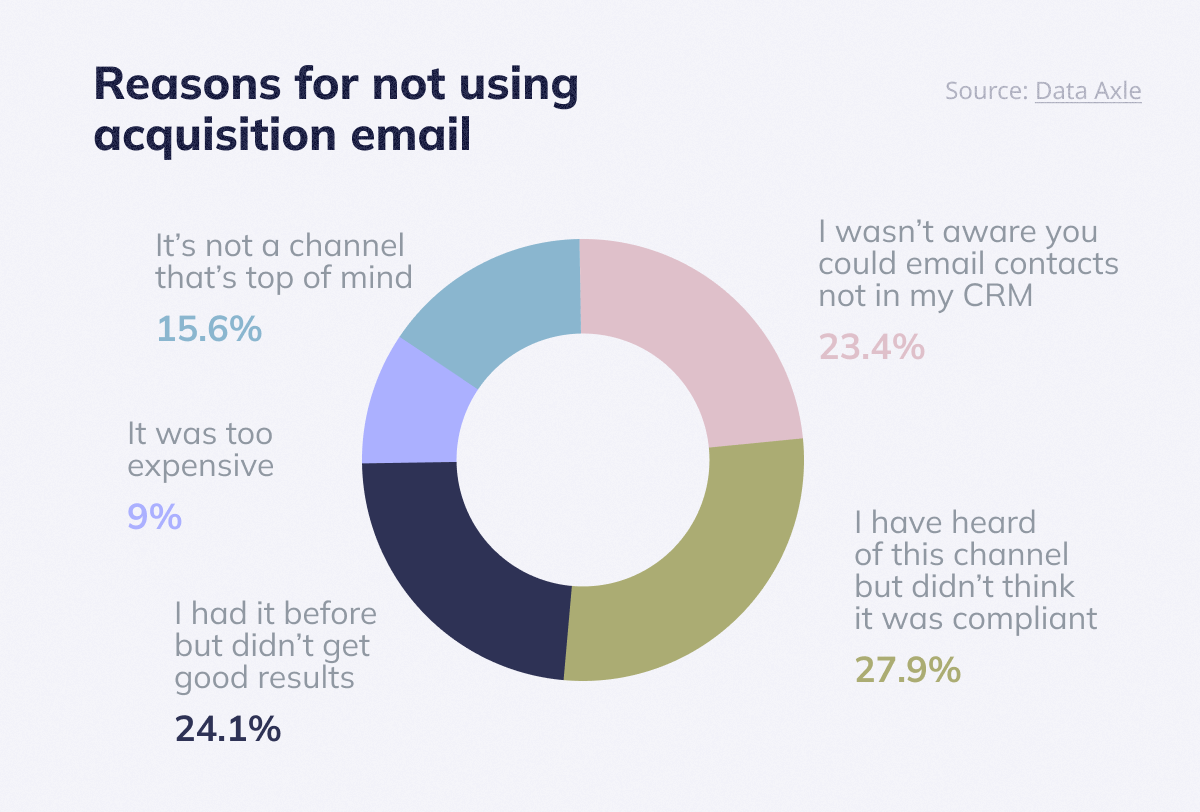
Email acquisition helps you grow your email lists and reach new people. A lot of people think you can't use acquisition emails, but they're totally legal when you use reputable partners who make sure people opt-in.
Combining email acquisition with other channels can make campaigns better. When you use email with other channels, like social media, engagement rates go up by 20%. (Data Axle)
Adding data tools to email acquisition can make your marketing even more efficient. Haven Life did a marketing campaign with a lookalike audience based on their existing customer data. They got 12% more quote forms completed and spent 23% less per lead than other platforms. (Data Axle)
By using acquisition emails and data-driven strategies, you can reach new customers and make your brand more well-known.
Email acquisition helps grow email lists and reach new audiences. Contrary to misconceptions, acquisition email is 100% compliant with current privacy laws when using reputable partners who ensure opt-in consent for third-party solicitations.
It's tough to get people's attention. Just speaking their language isn't enough, you need to be creative.
Many brands have sacrificed quality for speed, focusing on efficiency over creative impact. But bringing back craft, playfulness, and attention to detail will lead to long-term success.
Far Cry 6 email: Selzy's blog talks about this unusual email that went viral on Reddit with 4.5k upvotes. It shows how creative approaches can be really powerful. (Selzy)
Brands like Jacquemus and Maybelline add fun elements to surprise and engage their audience. They make content that starts conversations and shows off their playful personalities.
Home security brand Ring used the "alien confirmation" news to have a contest to see who could capture aliens on their cameras. It shows how embracing disruptive things within your niche can lead to unexpected engagement and brand awareness. (We are social)
Creativity doesn't have to be over-the-top. It can be subtle, fun, or just unexpected. By taking calculated risks and experimenting with creative approaches, you can make your email marketing more engaging and successful.
This report compared email performance rates. By looking at different industries over the past four years (2020-2023), we found out something important: understanding how users behave is really important for success.
Benchmarks are a good starting point. The next step is to watch trends and figure out what depends on what. You need to always be paying attention to how user behavior changes because of things like the economy and world events. These small and fast-changing trends can be hard to keep up with.
To stay ahead of the curve, data is your most valuable tool. Using data analytics, businesses can find out what customers want and adapt to their changing preferences. You can get real-time insights and keep track of bigger trends that might influence user behavior.
Using data and being flexible, you can make a dynamic email marketing system that connects with your audience and gets consistent results.