
Marketers hear a lot of advice about the best time to send, the perfect subject line and how often to email. Selzy looked at what actually happened instead.
We analyzed 388,431 real campaigns and 602.2 million emails sent from June to August 2026. We looked for patterns in opens, clicks, delivery and unsubscribes. Unlike survey-based reports, this study is based on real campaign behavior.
The study covers Selzy campaigns created from June 1, 2026 to July 31, 2026. Open rate and CTR are based on delivered emails and unique opens or clicks. Platform averages are weighted by email volume unless we say otherwise. The median campaign open rate was 13.6%, while the weighted average was 11.0%. Large, low-engagement sends pulled the weighted average down.
Send time is recorded in server time (UTC+1). Triggered and automated emails are compared with mass or manual campaigns, but the automation sample is smaller. Open tracking uses a tracking pixel, so Apple Mail Privacy Protection and automated scanners can affect open data. The last few weeks of the study may also have slightly incomplete open data.
These are real-world patterns, not controlled A/B tests. They show where results were different, but they do not prove that one tactic caused the difference. One more point matters: casino and betting senders changed their sending behavior sharply during the year, which affected some platform-wide averages.
Eight findings stood out across the dataset. Each one compares real campaign results, so the numbers show what happened:
Smaller sends were associated with much stronger engagement. Campaigns sent to fewer than 100 recipients reached a 23.6% open rate and 4.8% CTR, while campaigns sent to 100,000+ recipients averaged 5.7% opens and 0.4% CTR. That is roughly four times the open rate and twelve times the click rate.
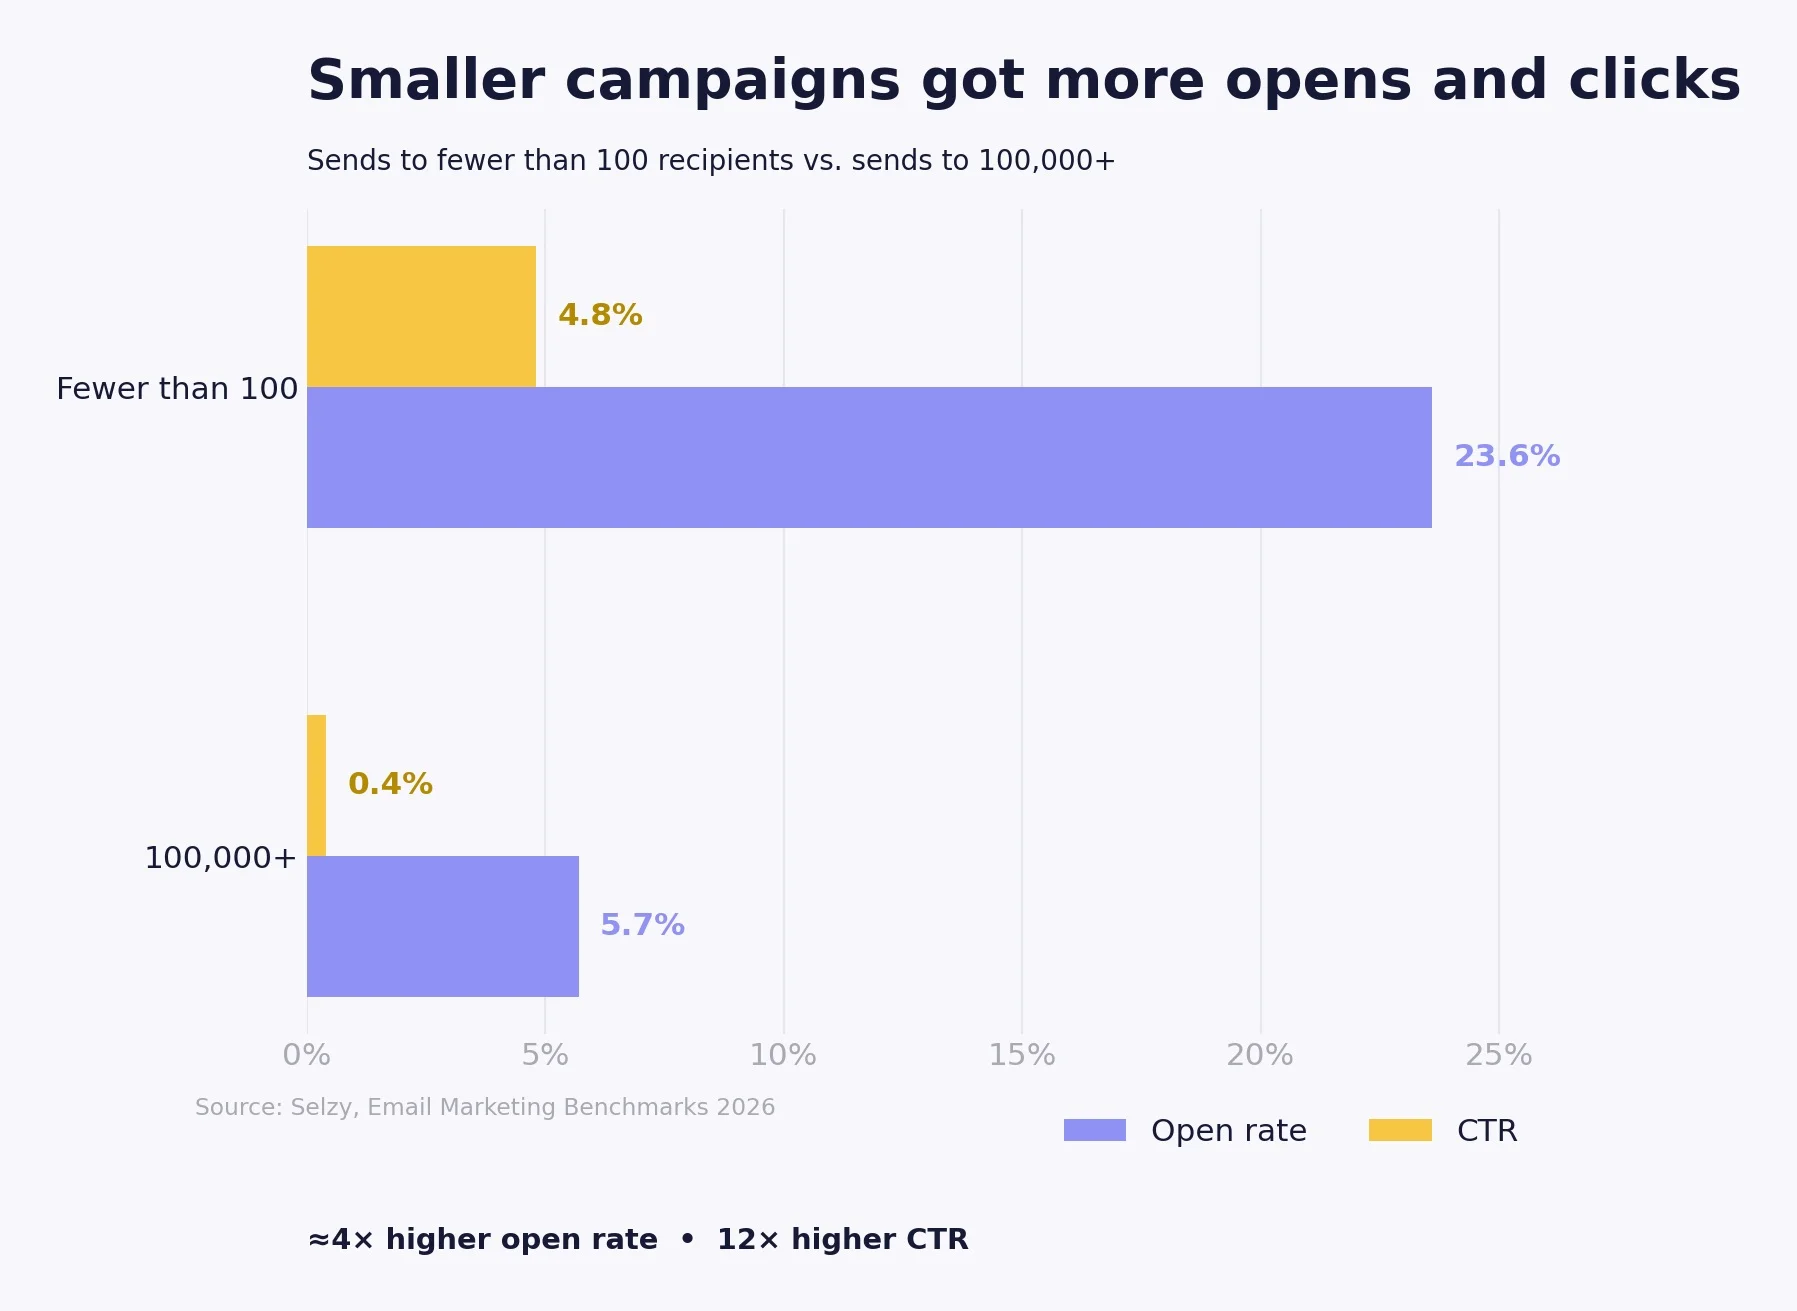
The chart shows the same direction across the other list-size groups. Smaller campaigns are often sent to more specific groups, so one message may fit the audience better. The data does not prove that segmentation caused the lift, but the gap is large enough to question sending the same message to everyone.
“A big database can look impressive, but size alone says little about the relationship with the people on it. I would rather see a team know which contacts still have a reason to care. List size is just a number. Relevance is what drives results,” says Andrew Dyuzhov, Marketing Director at Selzy.
Triggered and automated messages had a 31.4% open rate and 6.4% CTR, compared with 11.0% opens and 1.2% CTR for mass campaigns. Automated emails were therefore opened almost three times as often and clicked 5.3 times as often.
The likely advantage is relevance in time. A welcome email arrives just after signup, when the brand is still fresh in someone’s mind. An abandoned-cart message follows a clear shopping action, while a re-engagement email responds to a visible drop in activity. In each case, the email is tied to something the subscriber has just done - or stopped doing - which gives the message a stronger reason to exist.
“Automation does not have to be complex. The real value is finding the moments when a customer gives you a clear reason to contact them - and not missing those moments. A welcome series, a follow-up after an important action and a re-engagement flow can already make an email program feel much more relevant,” says Andrew Dyuzhov, Marketing Director at Selzy.
The largest concentration of email volume appeared around 2-3 PM, with roughly 109 million emails delivered across those two hours. Yet opens were only 8.8% at 2 PM and 7.8% at 3 PM, both below the 11.0% platform average. At 8 AM and 12 PM, the open rate reached 12.9% on substantial volume.
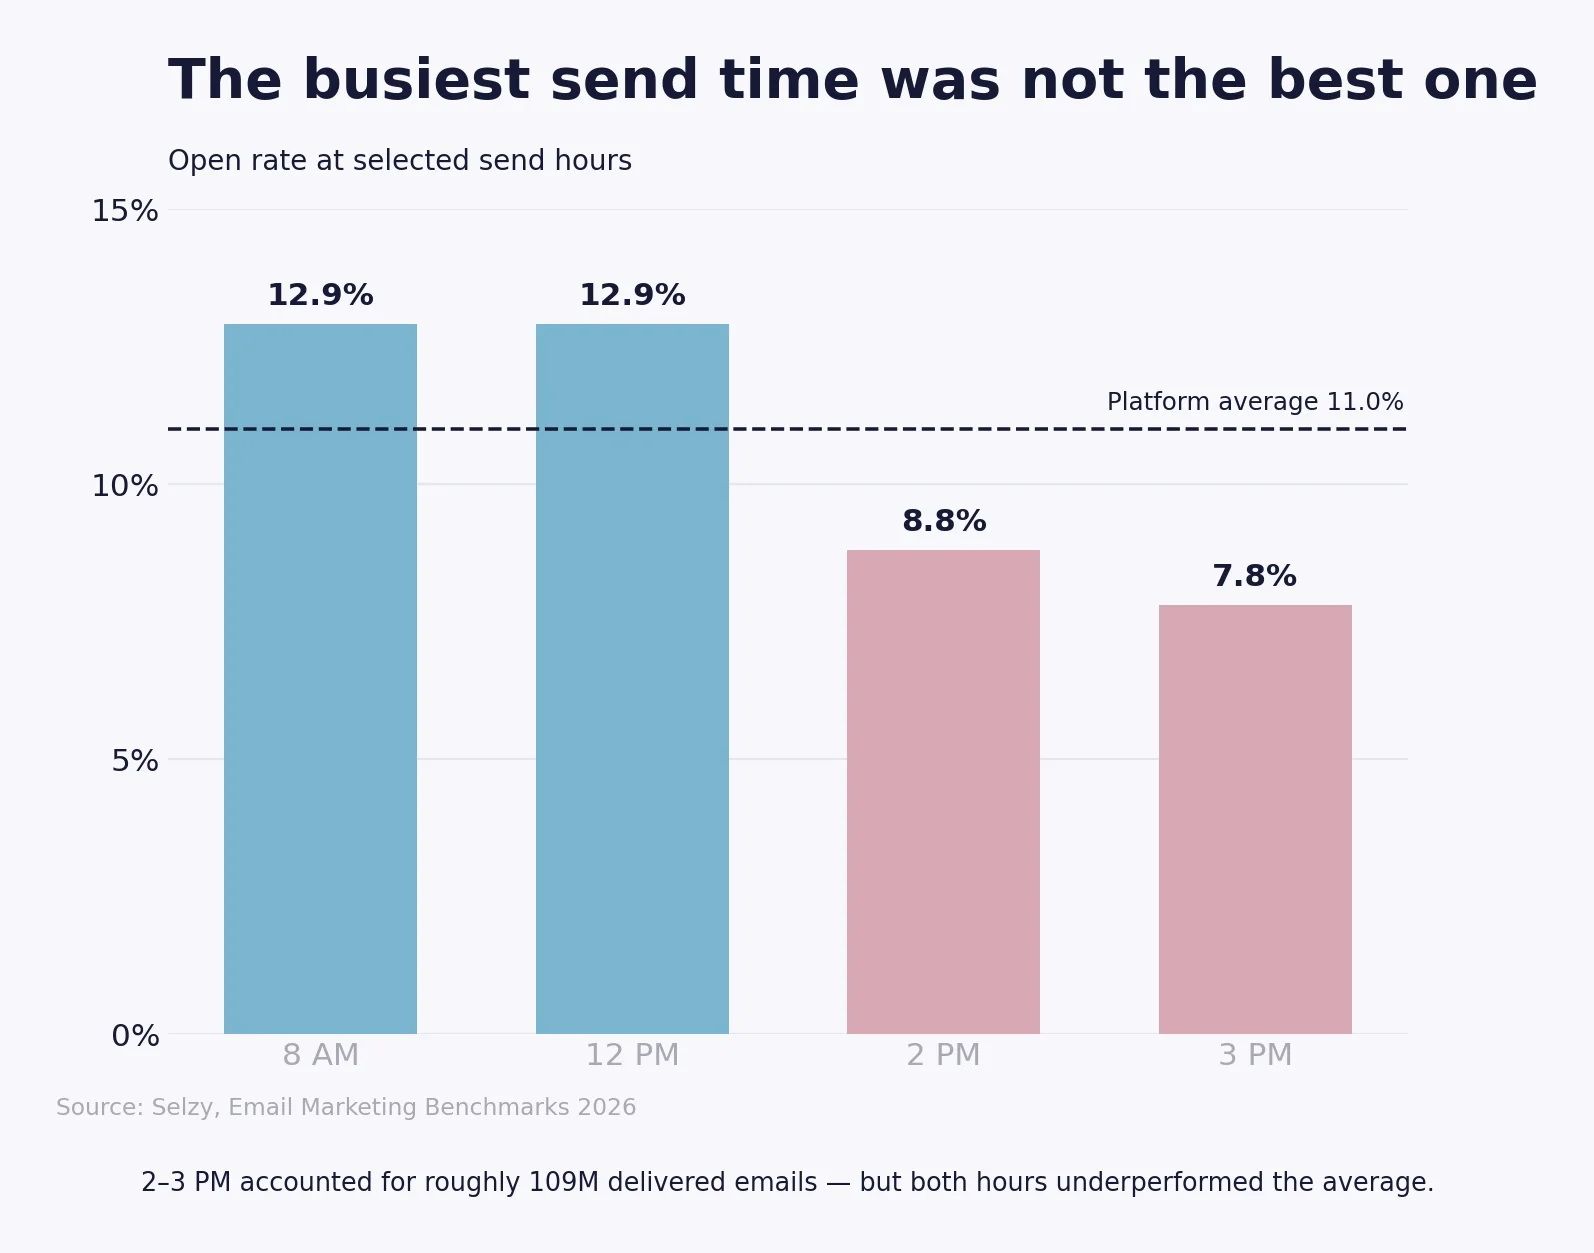
Evening sends produced some of the highest CTRs in the table, but their volume was much smaller, so the data does not support a universal “best hour.” The more useful finding is that the most common hour was not the strongest one. Habit and convenience may determine send schedules more often than measured audience behavior.
“The most popular send time in our data was not the strongest one. That is a good reason not to treat someone else’s ‘best time to send’ as a rule. If a team sends at the same hour just because it is convenient, that is worth testing,” says Andrew Dyuzhov, Marketing Director at Selzy.
Tuesday had the strongest weekday engagement, with a 12.6% open rate and 1.44% CTR. Friday stood out for another reason: its delivery rate fell to 87.3%, compared with about 91-92% on most weekdays.
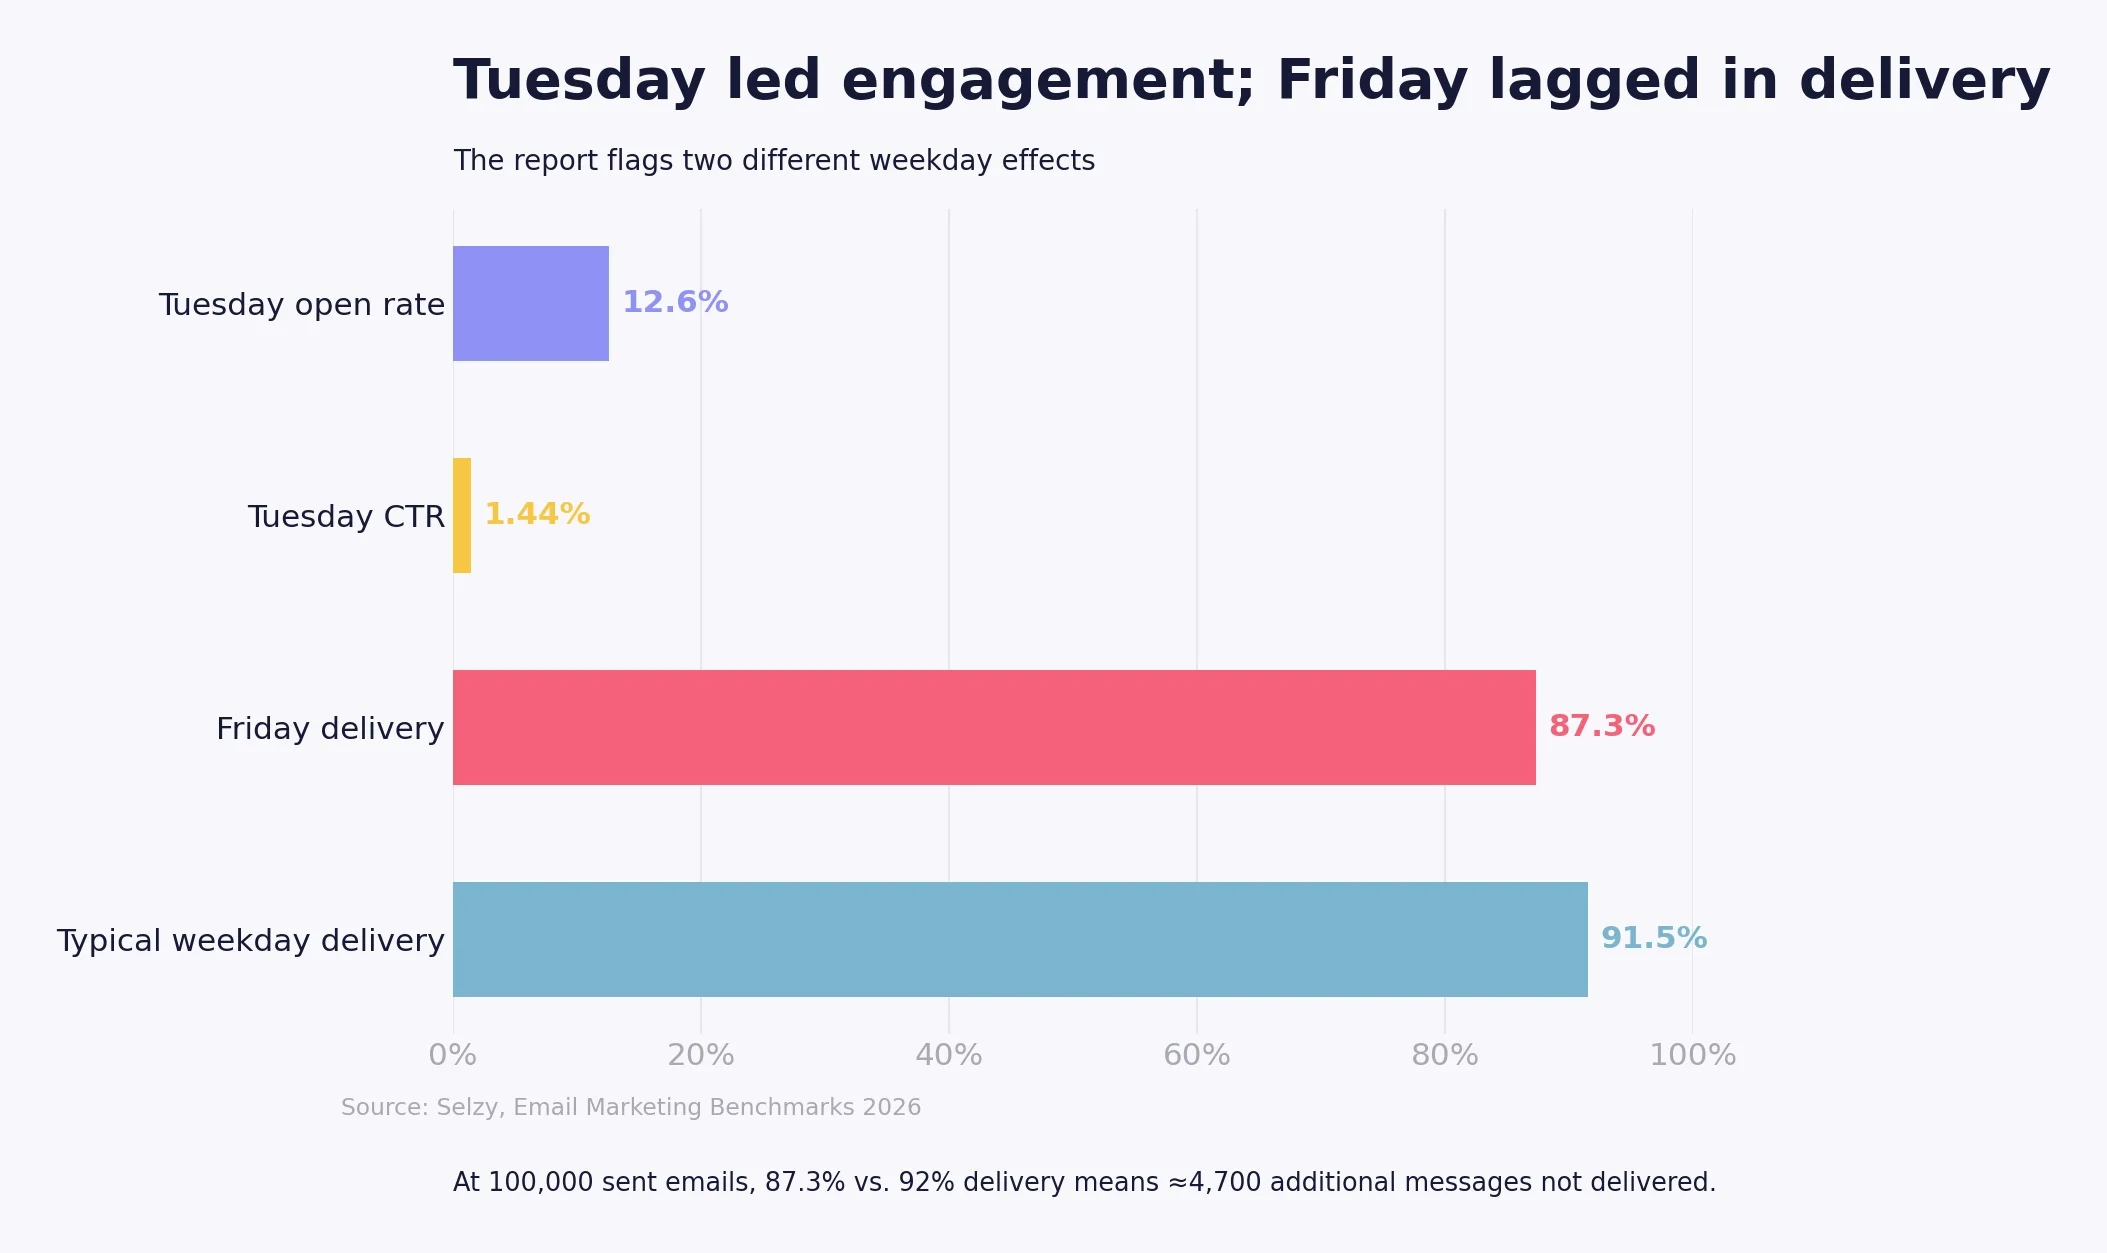
On a send of 100,000 emails, the gap between 87.3% and 92% delivery means about 4,700 more messages do not reach the inbox. The data does not show why Friday was weaker, so we should not blame one cause. But it does show that delivery matters just as much as opens and clicks when teams review performance.
“A four- or five-point delivery gap can matter more than a small lift in open rate. Before changing subject lines or creative, marketers should first make sure the email is reaching people. Deliverability is part of marketing performance, not just a technical issue,” says Andrew Dyuzhov, Marketing Director at Selzy.
Several common subject-line tactics were linked to weaker results. Emoji subject lines had a 0.75% CTR, compared with 1.68% without emoji. Subjects with numbers or percentages had a 9.9% open rate and 0.96% CTR, versus 12.0% opens and 1.4% CTR without them.
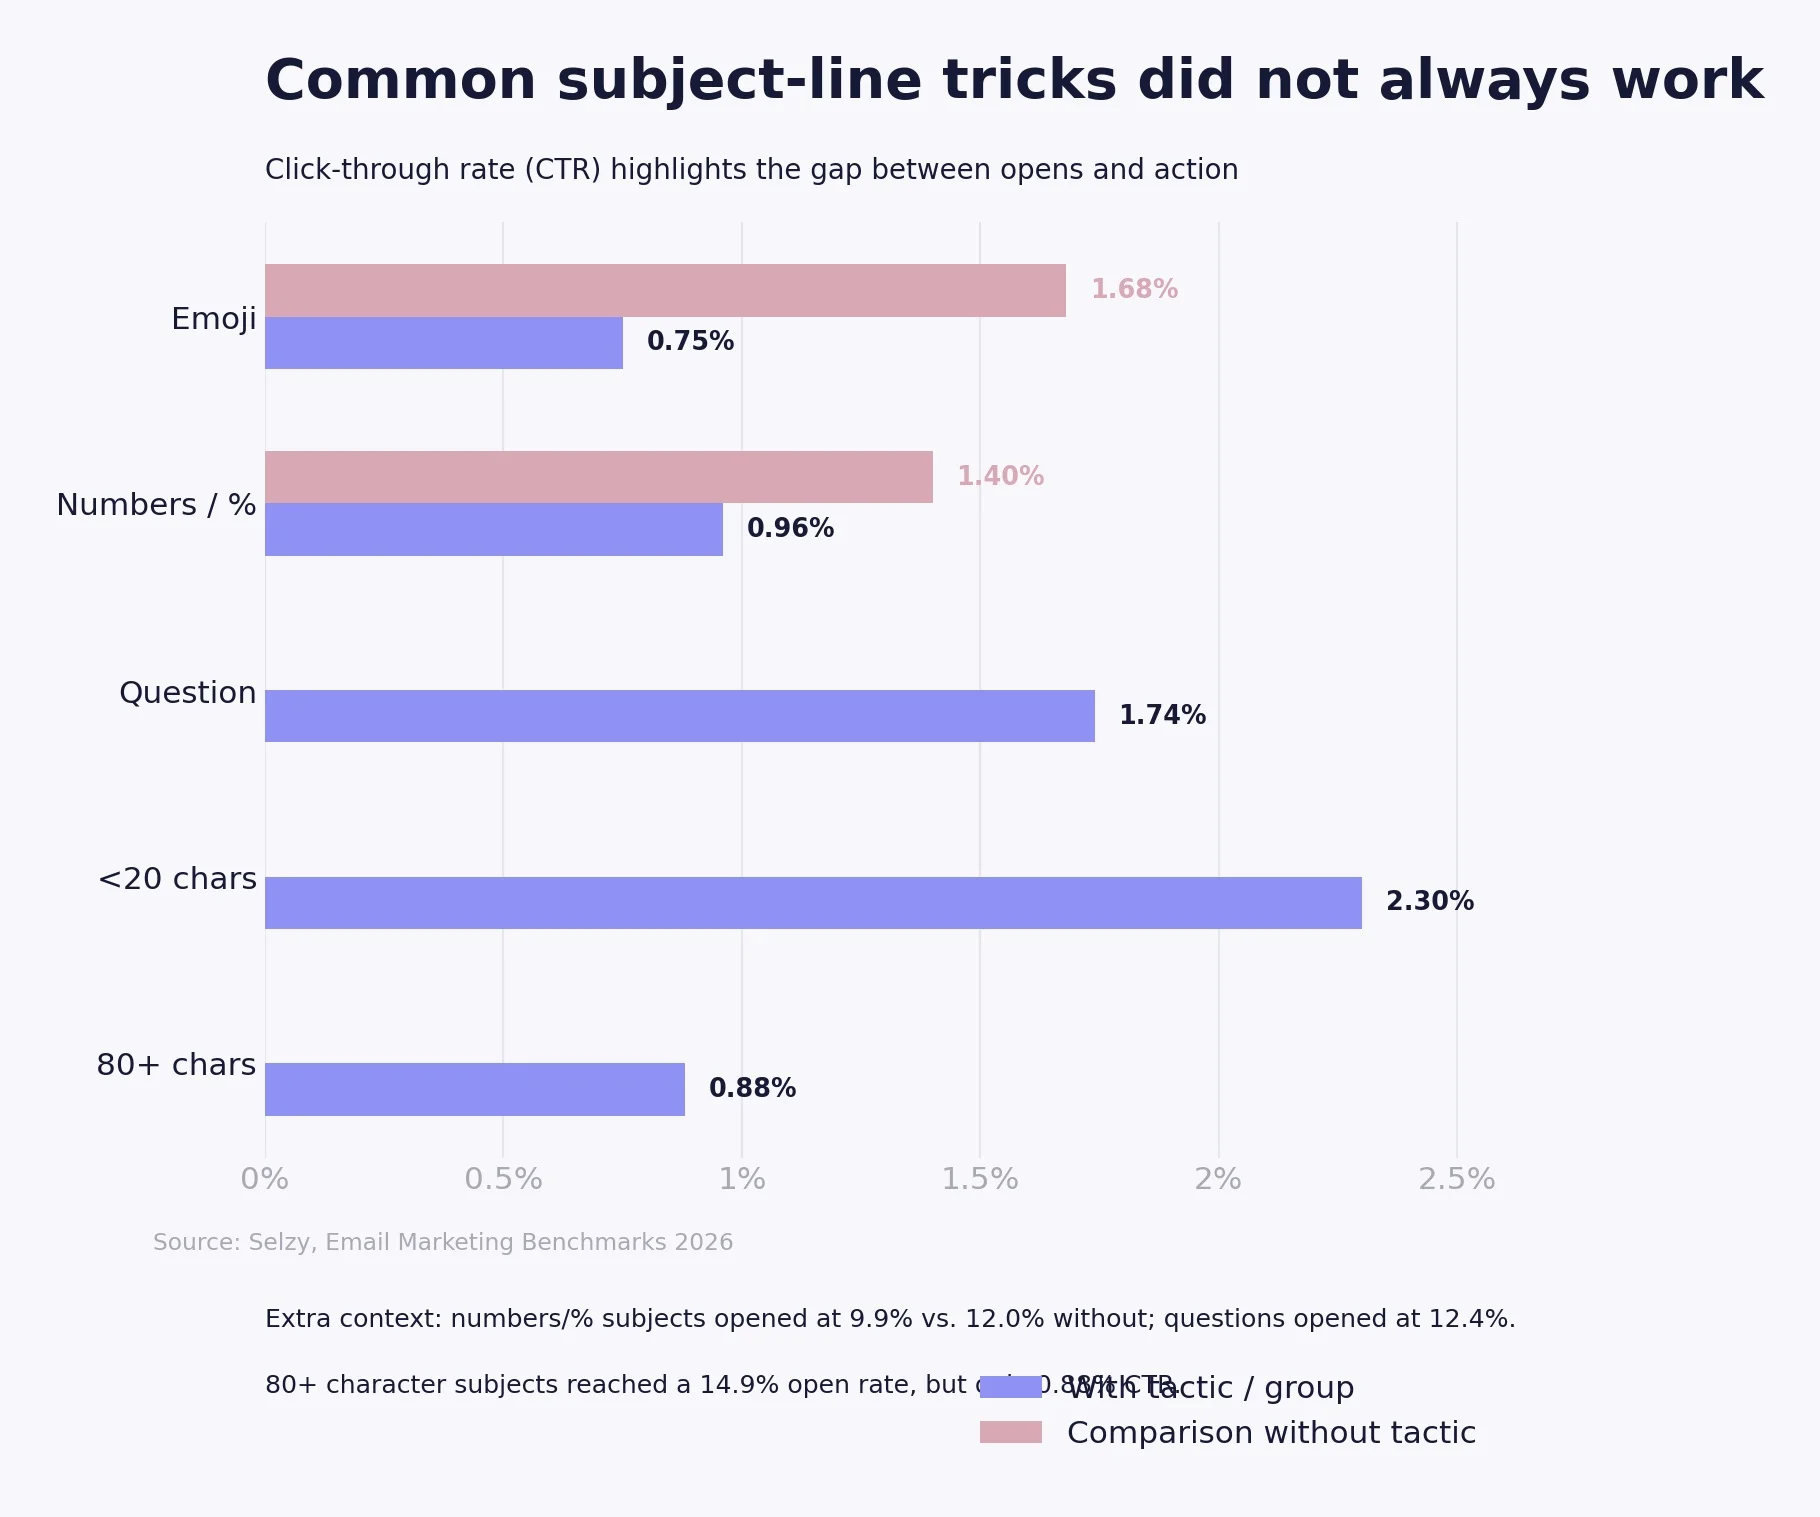
Questions were the clearest exception. Question-style subjects reached a 12.4% open rate and 1.74% CTR, so both metrics moved up. Length also showed an interesting split: subjects under 20 characters had the highest CTR at 2.3%, while subjects of 80+ characters had a strong 14.9% open rate but only 0.88% CTR.
Using a first name had only a small effect: 11.9% opens versus 11.0% without the name, and no lift in clicks. The lesson is not “always use questions” or “never use emoji.” It is that getting an open is not the same as getting action.
“A subject line can get the open and still lose the reader right after that. That is why I would rather see marketers focus on the next action than celebrate opens alone. A click tells you much more about whether the message matched what the subscriber wanted,” says Andrew Dyuzhov, Marketing Director at Selzy.
Tourism campaigns averaged a 30.2% open rate, while marketing agencies averaged 7.7%. That is almost a 4x gap. Nonprofits reached 23.0%, while IT averaged 8.9%.
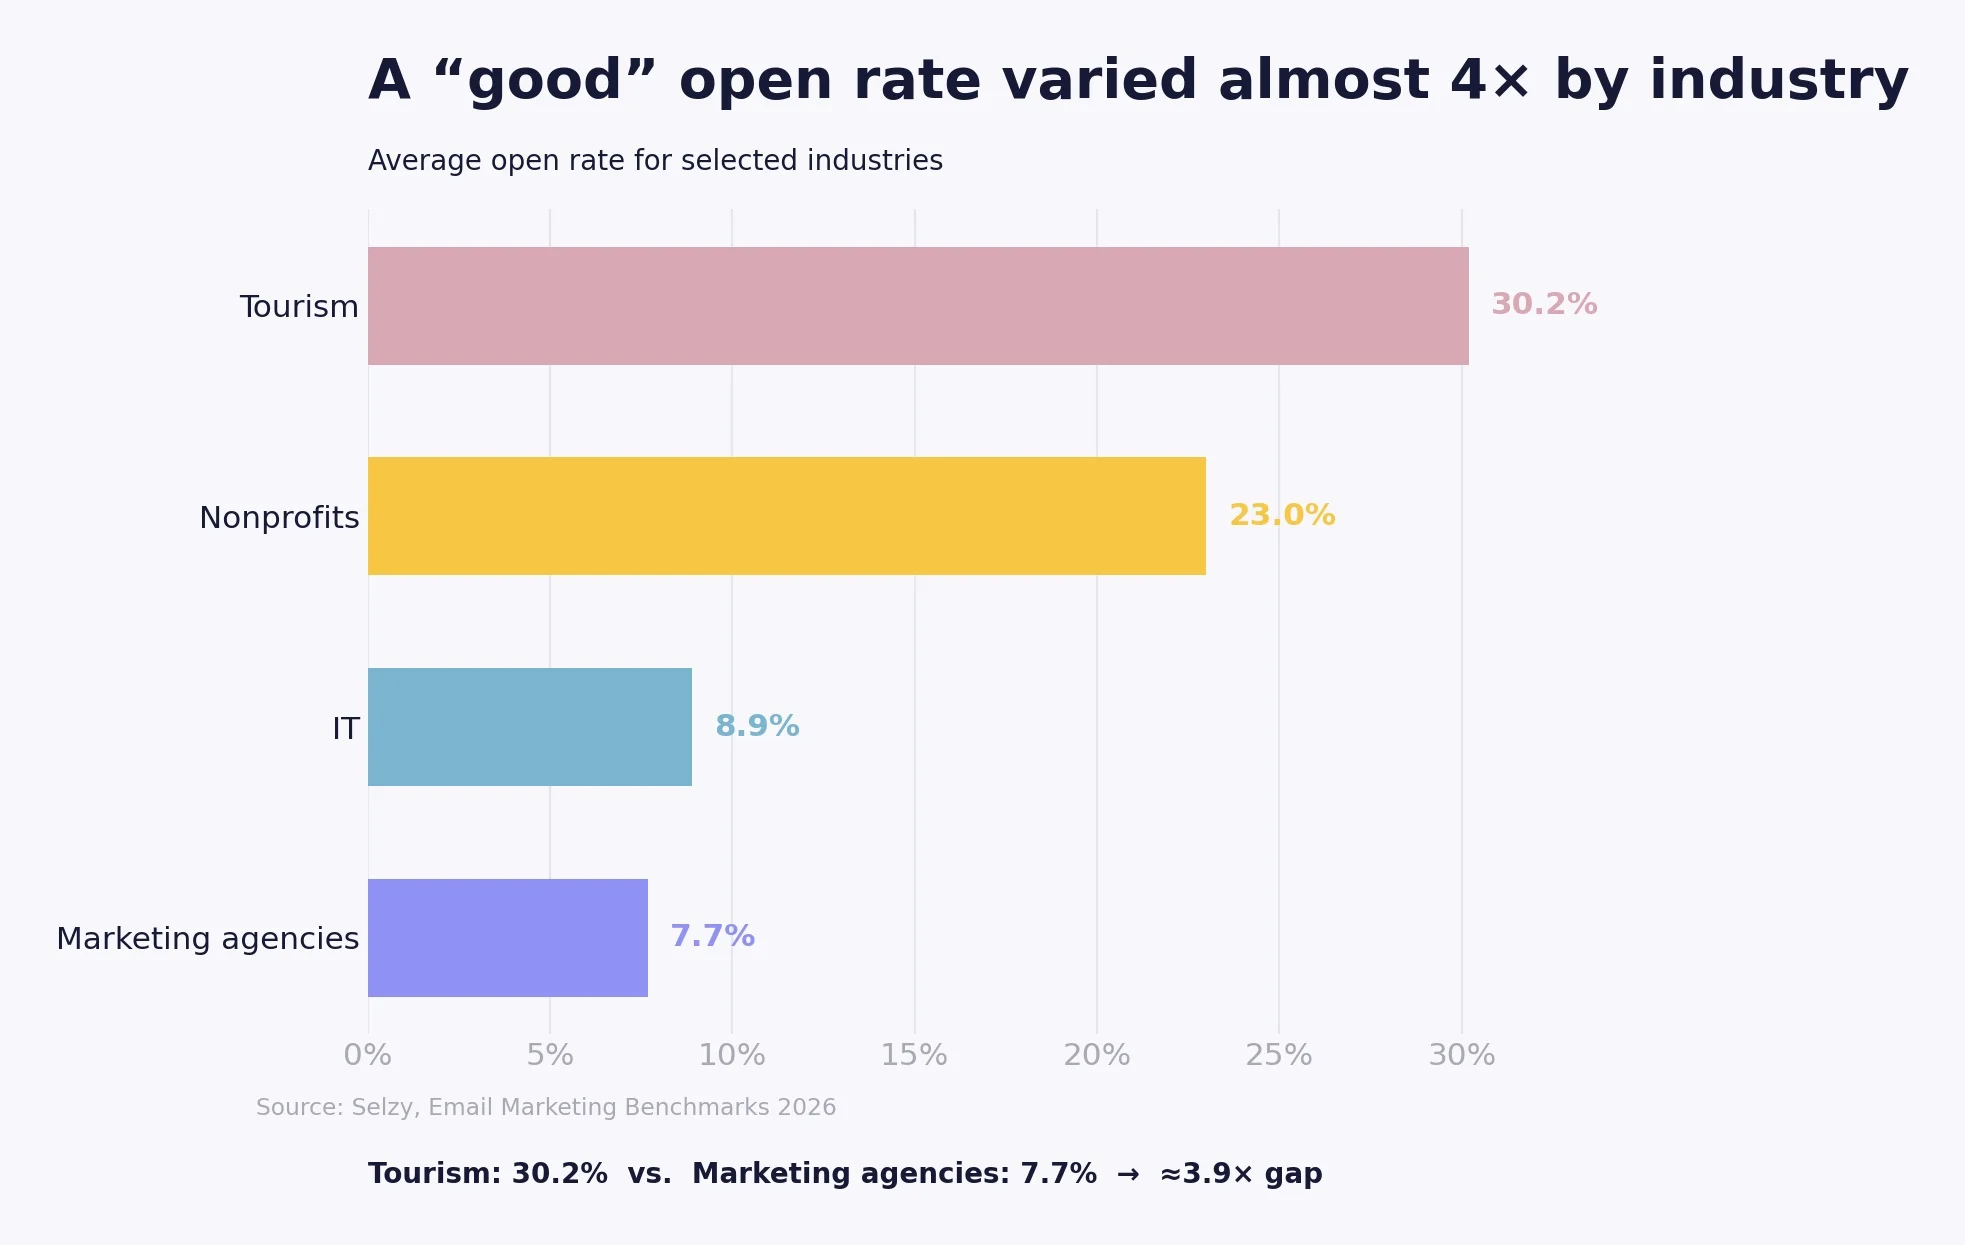
This does not mean tourism companies always write better emails. Different industries have different relationships with their audiences. Some emails arrive around a booking, a service need or another high-interest moment. Others compete in crowded work inboxes. So a platform average is useful as context, but not as a target for every business.
The marketing-agency result is especially interesting: people who work with campaigns every day were among the hardest audiences to engage by email. One possible reason is inbox competition, but the dataset does not prove that.
Across the platform, average monthly campaign count rose from about 15,000 to 71,000. At the same time, average campaign size fell from about 4,300 recipients to 592. Casino and betting was the biggest driver of this shift.
In that category, campaign count grew from about 80 per month in August 2025 to 61,923 in June 2026 - about 774x more. Many of those sends were tiny, often reaching only 12 to 27 people.
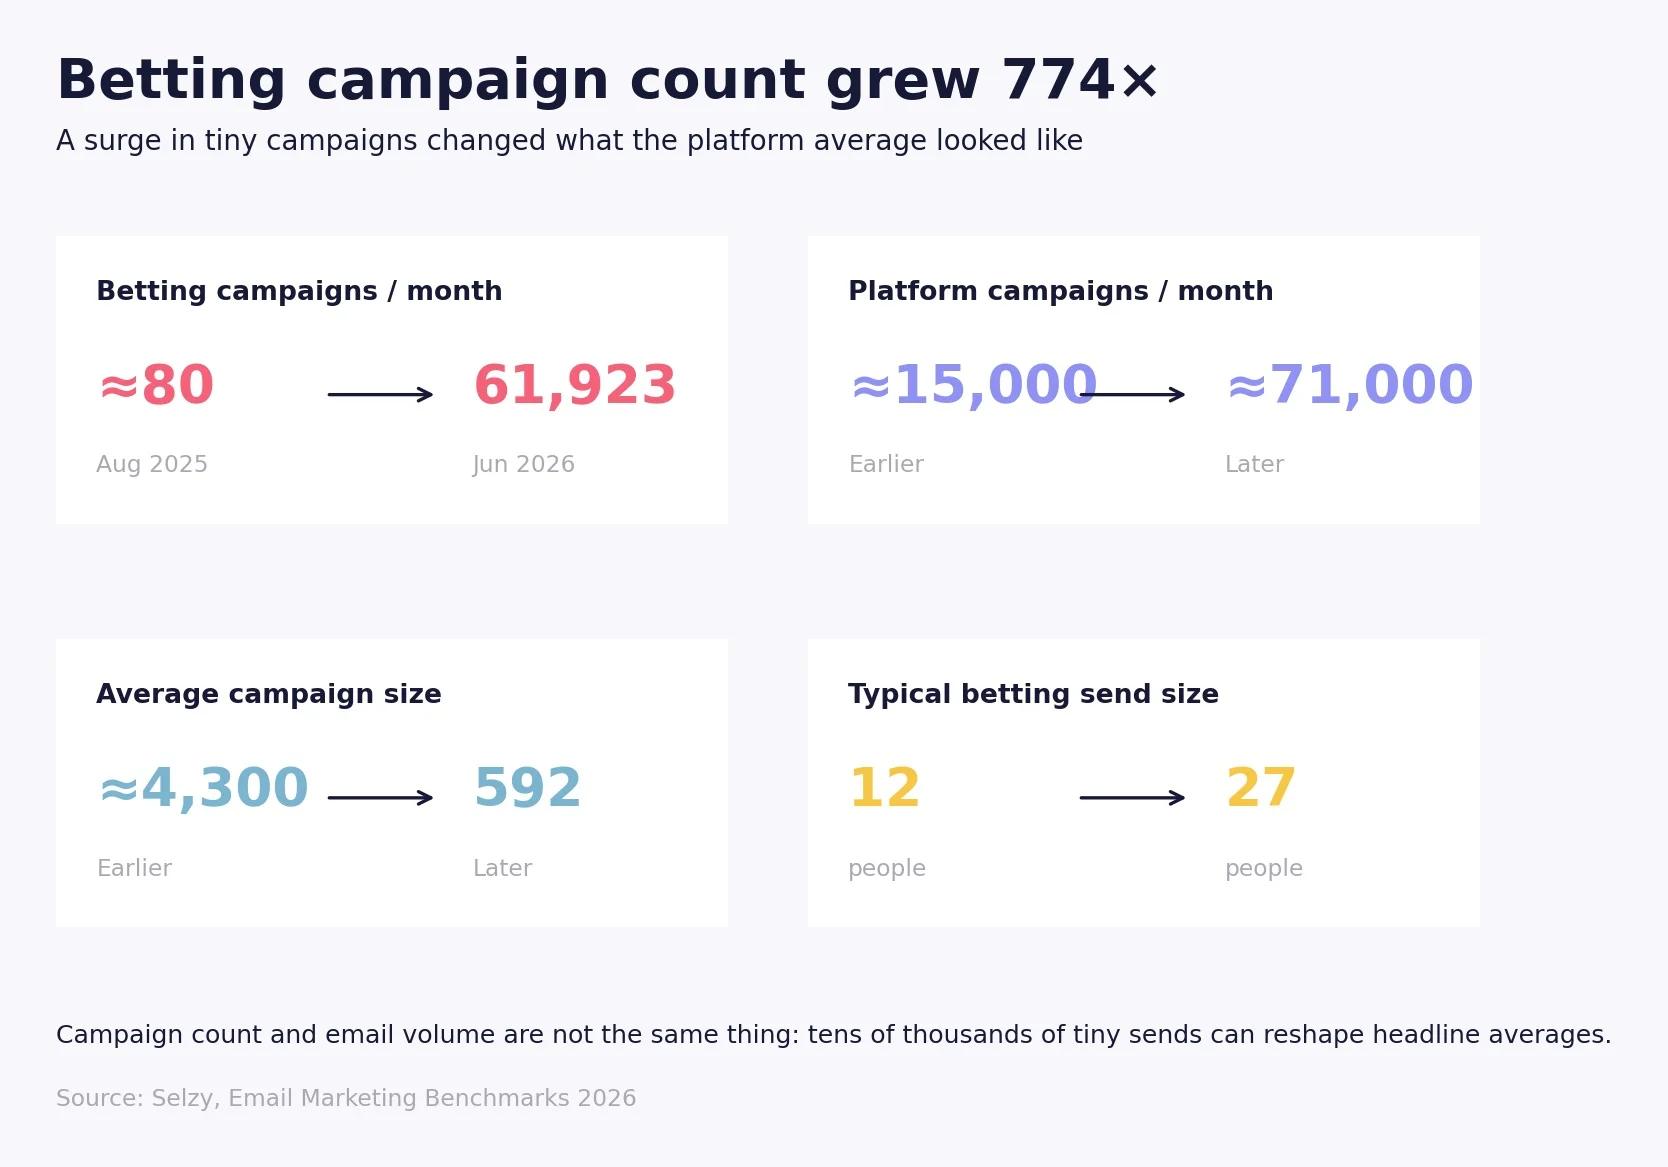
This matters because campaign count and email volume are not the same thing. One industry can create tens of thousands of tiny campaigns and make the platform look much more active without a similar rise in total delivered email. It also changes what the “average campaign” looks like.
“A benchmark is not fixed. If the mix of senders and campaign types changes, the benchmark changes too. Betting is a clear example: campaign count exploded, but many sends went to only a few dozen people. If you look only at the headline campaign count, you can easily tell the wrong story about what happened to email volume,” says Andrew Dyuzhov, Marketing Director at Selzy.
This is an extreme example from one industry. It does not mean email marketing as a whole is moving toward 12-person campaigns. The lesson is simple: medians, industry benchmarks, campaign-size groups and your own past results can be more useful than one platform-wide average.
Among about 173,000 unsubscribes where people gave a reason, 83.5% chose a version of “no longer interested” or “do not send me this.” Only 6.8% said emails came too often, while 6.1% said the messages looked like spam.
Among people who explained why they left, lost interest was more than 12x as common as too much email. So when unsubscribe rates rise, the first question should not only be “Are we sending too often?” It should also be “Has the content stopped being useful?”
“What stood out was how clearly lost interest dominated the unsubscribe reasons. Frequency still matters, but sending less may not fix the real problem. If the content no longer matches what people expected when they signed up, one irrelevant email is still an irrelevant email,” says Andrew Dyuzhov, Marketing Director at Selzy.
There is one important limit: people who simply stop opening emails do not appear in this data. But among people who gave a reason, lost interest was the biggest issue. The practical response is to check what people originally signed up for, separate active and inactive subscribers, and make sure the content still matches that promise.
The report does not produce one universal benchmark or one perfect tactic. It points to a more useful principle: email performance improves as the message becomes more specific to the audience, the moment and the reason for sending. Small campaigns outperformed very large sends. Triggered messages beat broadcasts. The busiest send time was not the strongest one. Subject-line tactics that looked persuasive on paper did not always translate into clicks. And people who explained why they unsubscribed overwhelmingly said they had lost interest.