Step 1
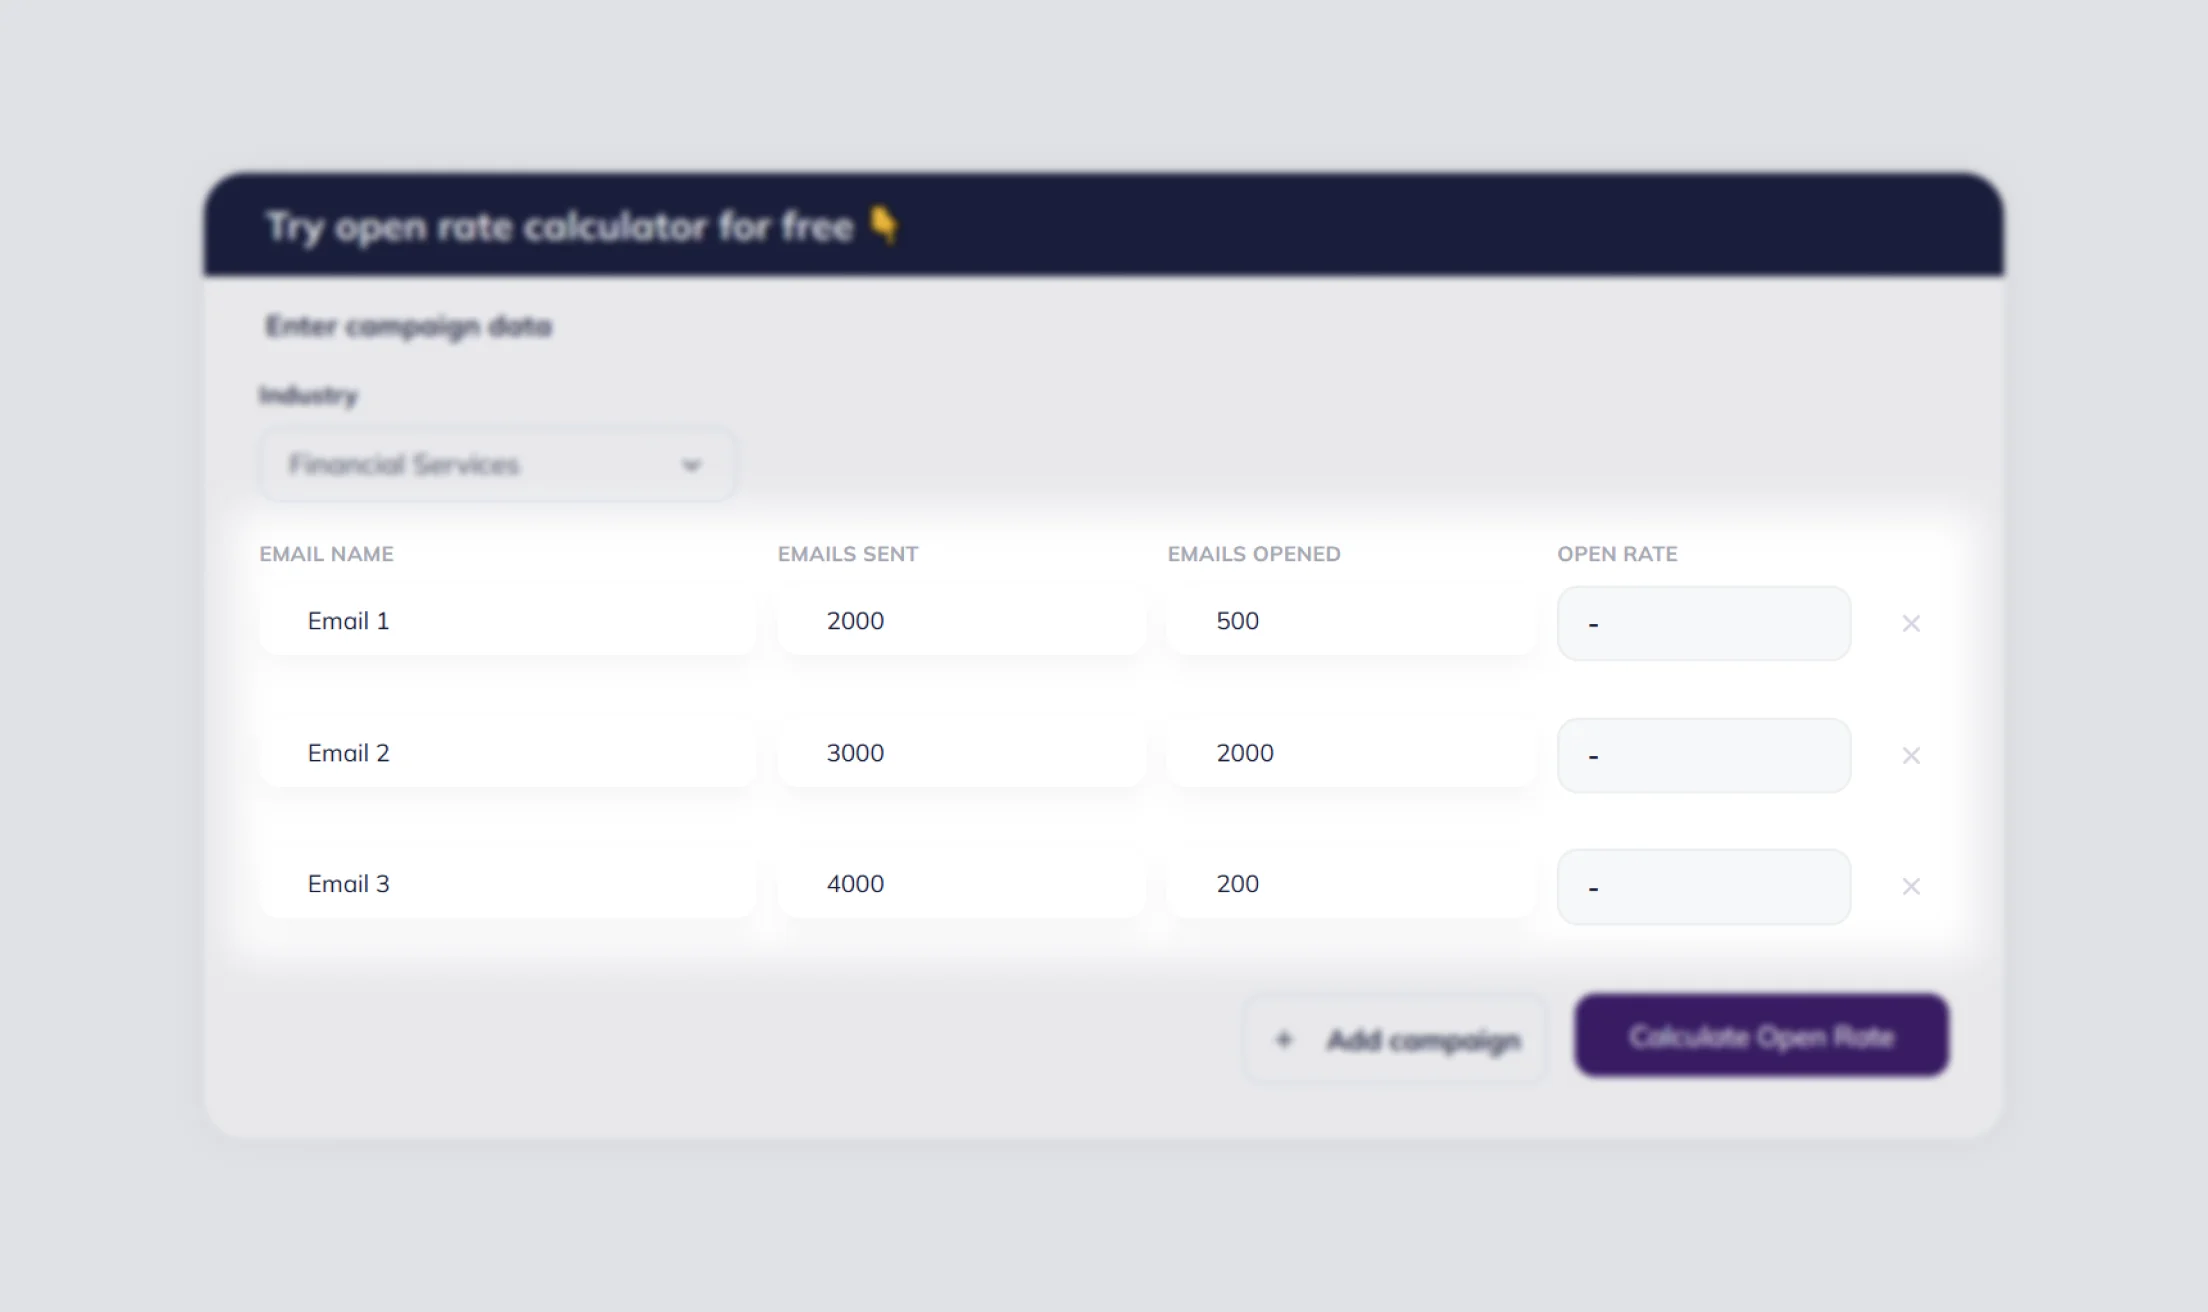
Choose an industry
Select your industry so the calculator can compare your open rate with a relevant benchmark.
Measure your email open rate for one or multiple campaigns, then compare the result with average benchmarks for your industry.
Open rate shows what share of recipients opened your email. It is one of the fastest ways to understand whether your subject line, sender name, audience, and timing are working. This open rate calculator helps you calculate email open rate for one or multiple campaigns.
Calculate your open rate in 3 simple steps 👇
Select your industry so the calculator can compare your open rate with a relevant benchmark.

Enter how many emails you sent and how many were opened. Add more campaign rows if you want to calculate your overall email open rate across multiple campaigns.
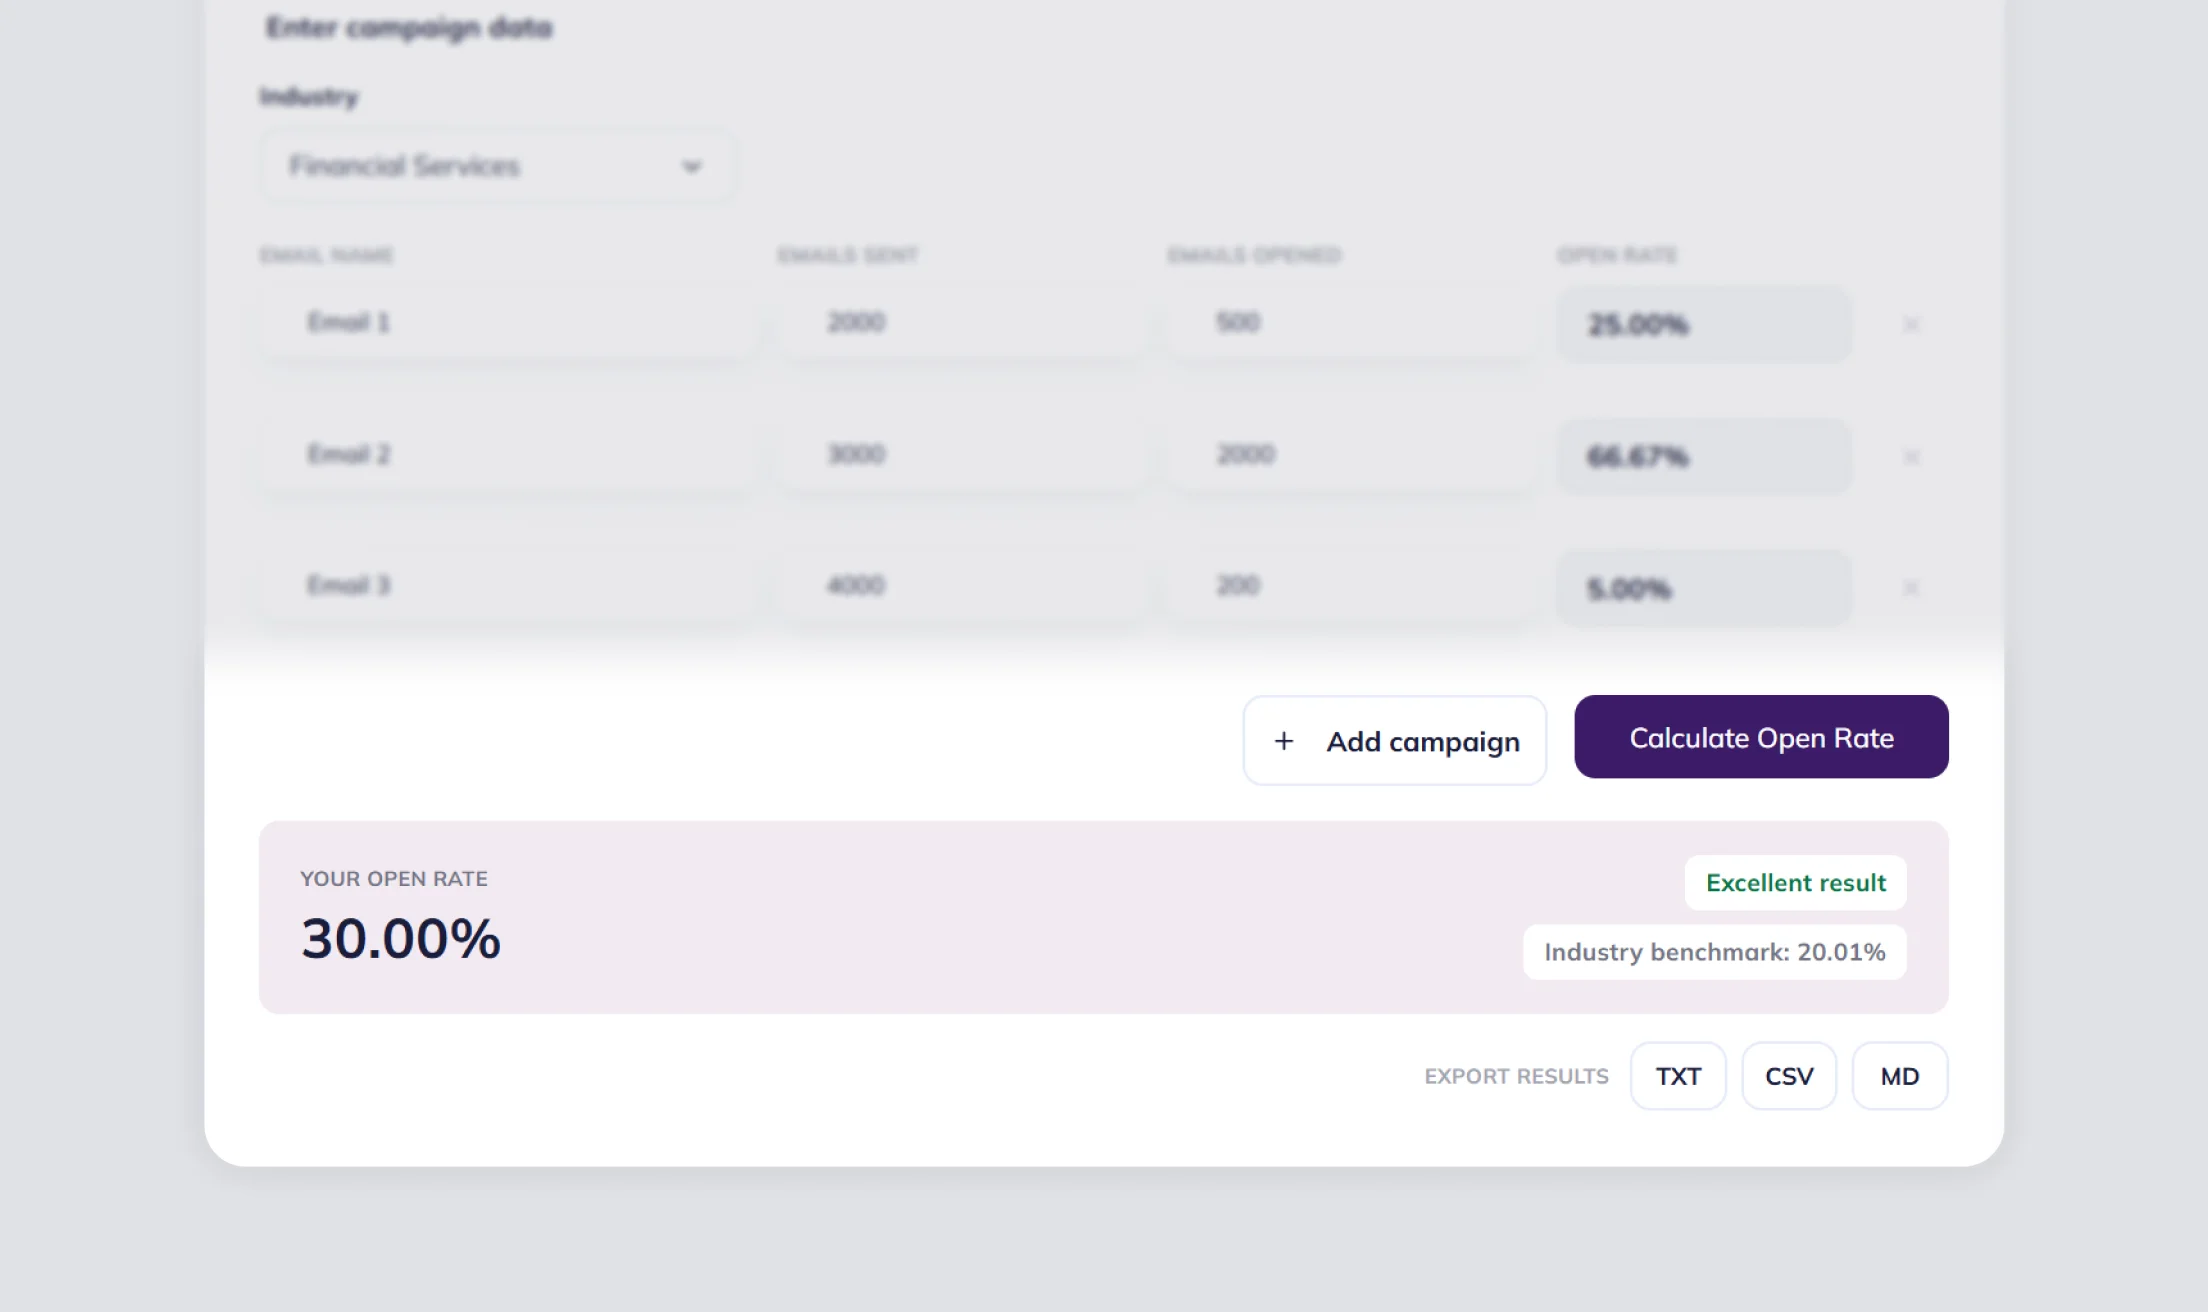
Review your open rate and see how it compares with the average for your industry.
Open rate shows how many recipients were interested enough to open your email after seeing it in the inbox.
A higher open rate often means your subject line, preheader, sender name, and brand recognition match what subscribers expect.
Comparing open rates across campaigns can help you spot stronger send times, audience segments, and regions for future emails.
Open rate does not guarantee conversions, but more engaged recipients usually create more chances for clicks, replies, and purchases.
Since Apple Mail Privacy Protection can preload tracking pixels, open rates may appear higher than actual human opens. Use open rate as a directional engagement metric and compare results over time instead of relying on a single campaign.
Email open rate is the percentage of recipients who opened an email out of the total number of delivered or sent emails you enter into the calculator.
The formula is simple: Open Rate = (Opened Emails / Sent Emails) × 100. If you add several campaigns, the calculator divides all opened emails by all sent emails. Many marketers prefer using delivered emails instead of total sent emails because it provides a cleaner open rate calculation.
There is no single universal good open rate. Benchmarks vary by industry: for example, Restaurants & Food is around 32.04%, Retail is around 24.84%, and Internet Marketing is around 17.62% based on the benchmark table used for this tool.
Yes. Add more campaign rows, enter sent and opened emails for each campaign, and the tool will show both row-level results and the overall open rate.
Open rate compares opened emails with the total number of sent emails. If opens are higher than sends, the input data is inconsistent and the result would not be meaningful.
Work on clearer subject lines, personalize campaigns, segment contacts, optimize emails for mobile devices, A/B test ideas, choose better send times, clean your email list, use a recognizable sender name, and avoid spam triggers.
Use delivered emails when possible because bounced emails can distort the result.
It may drop because of weak subject lines, poor timing, inactive contacts, deliverability issues, or audience fatigue.
Not always. Privacy features like Apple Mail Privacy Protection can make opens less precise.